Simplified device health monitoring and mapping for software-defined networks

Are you juggling too many different types of network monitoring dashboards at once? If you're using software-defined networks (SDNs) and also managing traditional networks, it can be quite challenging to monitor them both at the same time since you need to remember which tool is responsible for monitoring which network and keep switching between them. Doing this can be a real hassle, but worry not! In this blog, we'll explore SDNs and demonstrate how you can monitor them along with traditional networks that use the Simple Network Management Protocol (SNMP).
Monitoring SDNs
In traditional networks, traffic is directed using hardware components such as routers and switches. However, in SDNs, things work a little differently. Instead of hardware, software-based controllers, or APIs, communicate with devices to direct traffic within the networks. SDNs can control a physical or virtual network through software.
Usually, vendors provide dashboards with rudimentary metrics to help you keep track of SDNs. However, in organizations using hybrid networks, network admins often have to toggle between different monitoring tools to keep track of both traditional networks and SDNs. To avoid this, monitoring tools like Site24x7 leverage REST APIs to show you metrics from SDNs, like Cisco Meraki, and SNMP-enabled networks in a single tool.
Visualizing SDNs on a map
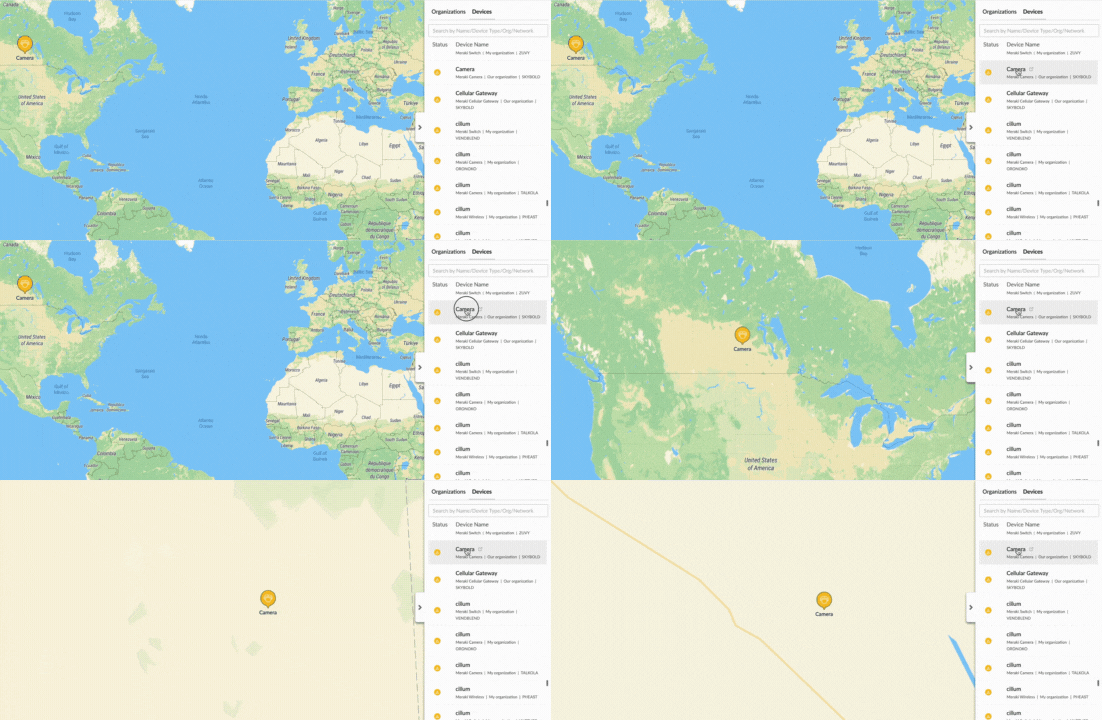
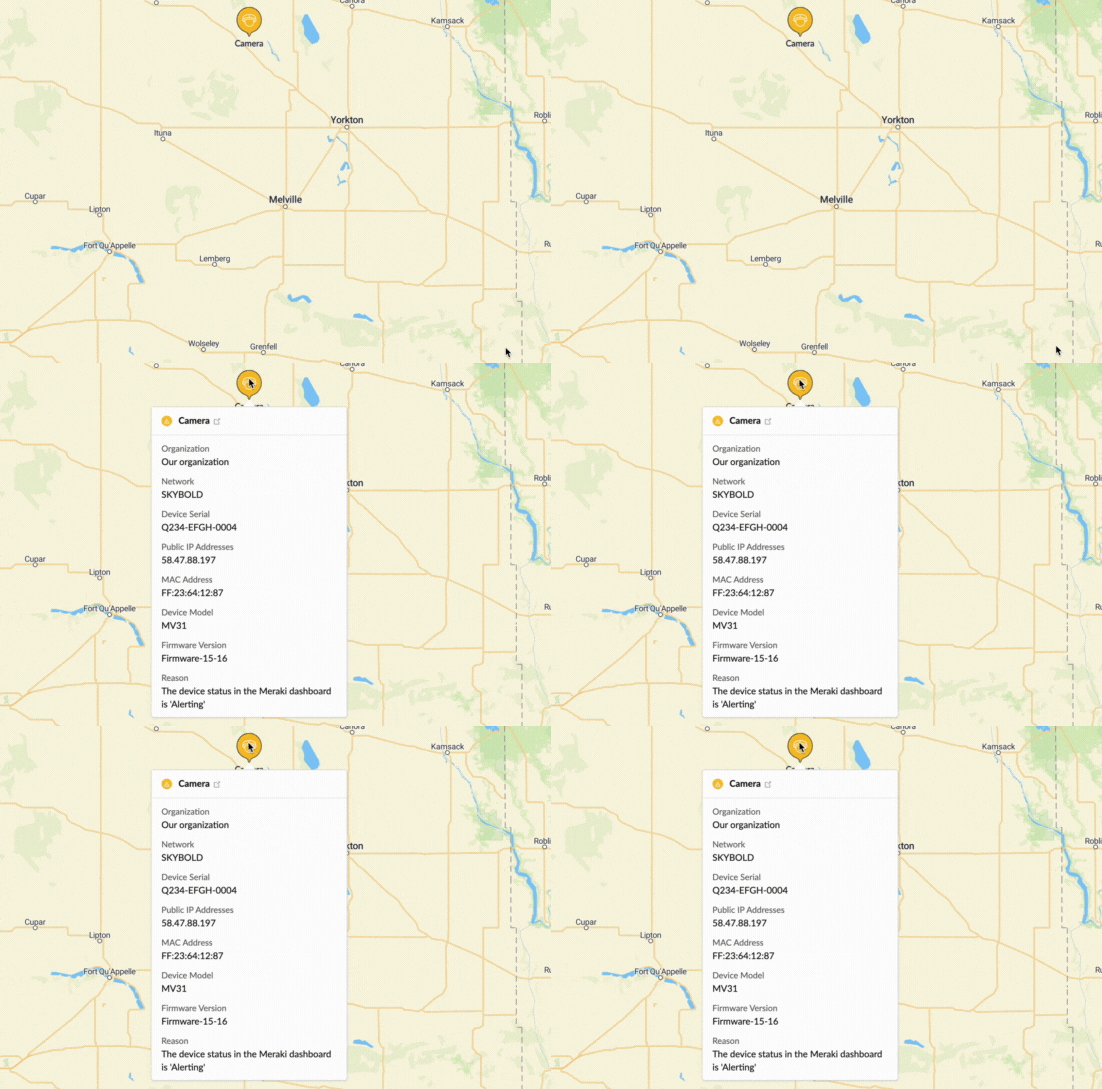
Visualizing SNMP-enabled networks becomes a breeze with both topology maps and Layer2 maps in Site24x7. When it comes to Cisco Meraki networks, the Meraki Map View elevates your experience to a whole new level. Imagine having the ability to see all your Meraki organizations and devices laid out before you in a single, intuitive view. This isn't just about seeing where your devices are; it's about instantly knowing which ones need your attention, all indicated by a simple change of the device's icon color.
To navigate to the device, all it takes is just a single click.

Discover the full scope of the device's details by hovering your cursor over it—dive deep with just a single movement!

How the Meraki Map View helps
Here are a few benefits of the Meraki Map View:
Convenience at hand:
Stay effortlessly informed! You'll receive instant, real-time updates about any changes to your device status from Cisco Meraki dashboards through REST APIs.
Logical blueprint:
The Meraki Map View showcases the layout of your Meraki organizations and devices, saving you the hassle of searching for each device's location individually.
Better capacity planning:
Prevent frequent issues in your devices by proactively boosting capacity where needed.
All-in-one tool:
Eliminate tool sprawl, streamline your operations, and enhance efficiency by monitoring all your SNMP-based and Cisco Meraki devices under one roof! No more juggling between multiple applications with varying user interfaces.
Site24x7: The go-to tool for unparalleled clarity and insight
Site24x7 offers a seamless network monitoring experience through different map options that cater to various types of devices. Many of our customers have been enjoying Cisco Meraki monitoring, which includes the Meraki Map View, for some time now. We're also planning to introduce monitoring for Cisco ACI soon, along with many other features that will make network observability effortless.
Get in touch with our team at [email protected] to learn more about our existing features and to see how our solution can best fit your organization.
Comments (0)