Tracking Microsoft SQL Slow Queries

The Microsoft SQL database is frequently used for storing, managing, and retrieving data for various application and computing purposes. However, one common issue that keeps the database from healthy functioning is slow query execution.
In this article, you will learn about slow queries and how to track the slow queries in your Microsoft SQL database using Site24x7's SQL Insights.
What are slow queries?
We know that efficient query execution is crucial for maintaining the performance and responsiveness of Microsoft SQL databases. Slow queries are inefficient queries that can lead to serious issues impacting the health and performance of the database. These queries can slow down the application performance and consume excessive resources, leading to database bottlenecks, impacting the user experience, and increasing costs.
This usually occurs when a particular query takes longer than usual to run and consumes more resources to retrieve data. Such slow queries need to be identified and optimized.
Why should you track slow queries?
- To improve database performanceSlow queries can choke database resources, leading to delays across your application. Tracking them allows you to identify and fix inefficiencies and keep your system running smoothly.
- To scale your databaseAs your business grows, the amount of data that needs to be processed also grows. The efficient queries that once worked may struggle to keep up with the scale. Hence, consistent tracking is a must to ensure your database remains scalable and responsive.
- To improve user experienceQueries that lag can frustrate users with delays in real-time applications. Optimizing these queries enhances performance and user satisfaction.
- To manage cost effectivelyResource-intensive queries drive up CPU, memory, and I/O usage, increasing operational costs. Addressing them helps reduce unnecessary resource consumption.
Learn about troubleshooting slow queries to improve database performance.
Tracking Microsoft SQL slow queries with Site24x7
With Site24x7 SQL Insights, the user can track slow queries and their execution time in multiple ways.
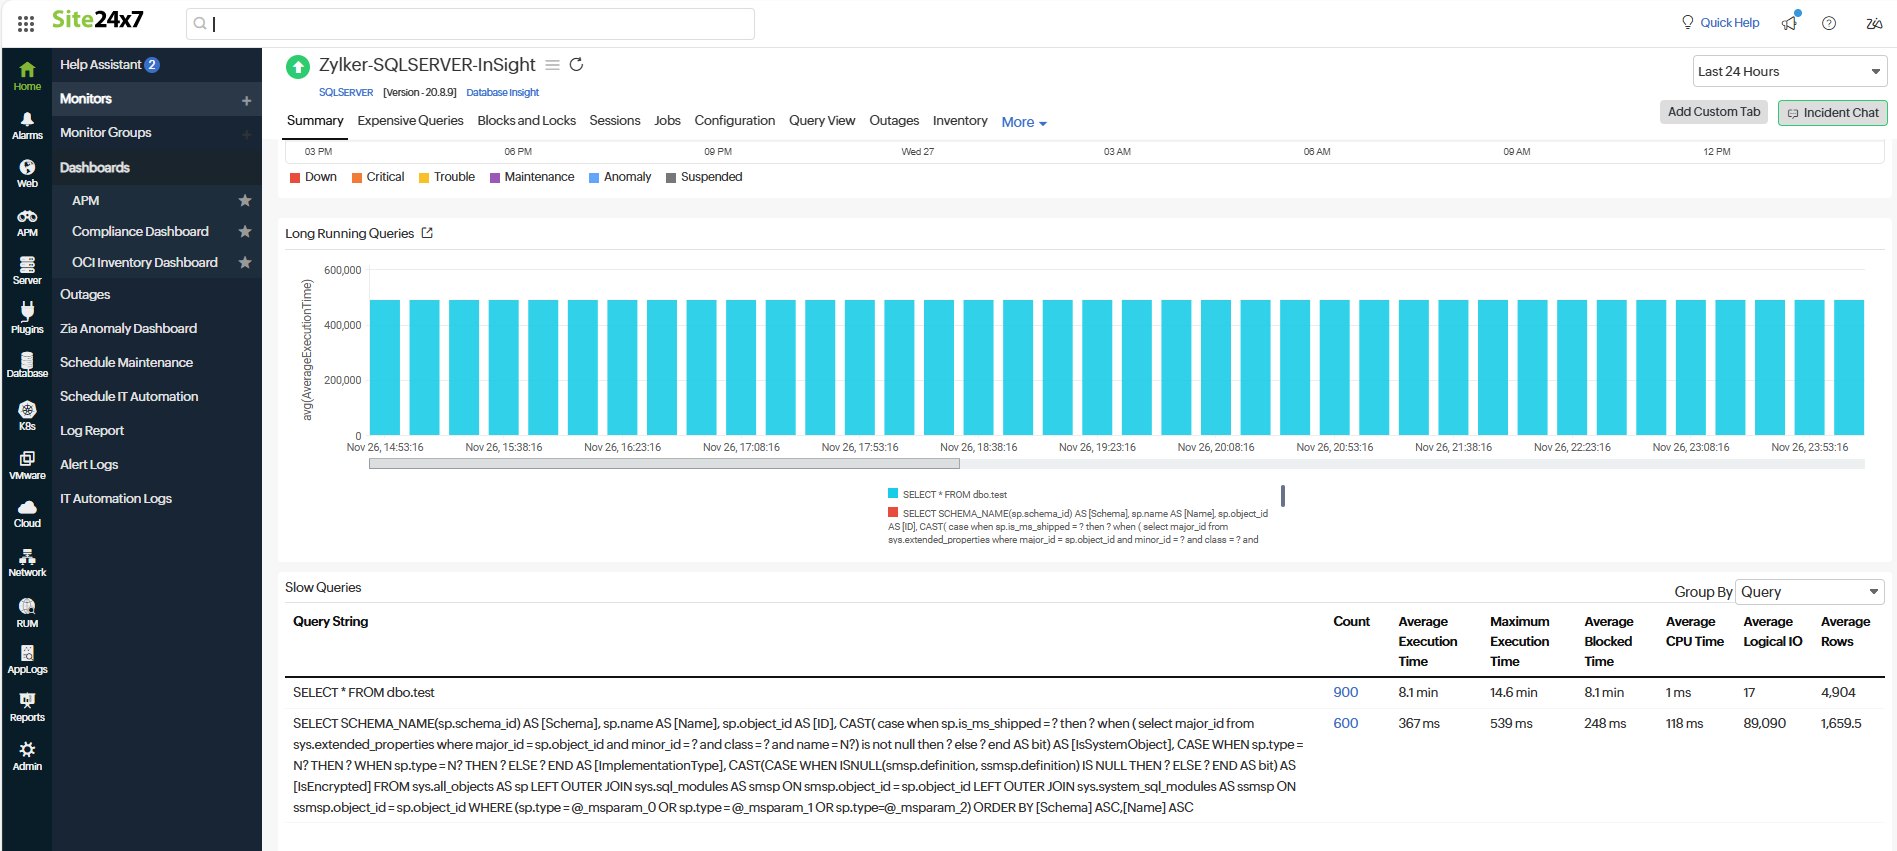
Site24x7 continuously tracks query performance metrics to flag slow-running queries. You will be able to view your query performance based on these indicators:
- Execution Times: Tracks average, minimum, and maximum query execution duration to identify performance bottlenecks.
- Blocked Execution: Highlights queries delayed by locks or resource contention.
- CPU and Memory Usage: Monitors resource-intensive queries that affect database performance.
- Logical Rows Processed: Identifies queries working with excessive data volumes, indicating potential inefficiencies in design or indexing.
Also, users can view long-running queries, expensive queries, and much more. Users will also get to know the Top N queries based on their CPU utilization, execution time, and so on.
These insights provide database administrators with a clear picture of query behavior, making it easier to pinpoint issues.
Proactive alerts for slow queries
With Site24x7, you are never caught off guard. Get real-time notifications when query execution time or resource usage exceed predefined thresholds.
Understanding the locking patterns or blocking events as they occur helps database admins resolve issues quickly. This proactive approach minimizes downtime and ensures consistent application performance.
You also get various charts that need your attention.

You will get to know the query information in a single view, i.e, the Query View. With this view, you will get to view the slow/expensive queries, top sessions, and failed jobs.
Deep pe with Query View
The Query View in Microsoft SQL Insight monitor enables you to view the queries along with the Query Hash, and many more information in a single view. You can customize this view by using the correct log pattern.
To get to the Query View, log into your Site24x7 account, navigate to Database > select Microsoft SQL Server > SQL Insights > select the monitor > click the Query View tab.
Tip 1: Pinpoint queries with longer execution times that impact your database performance
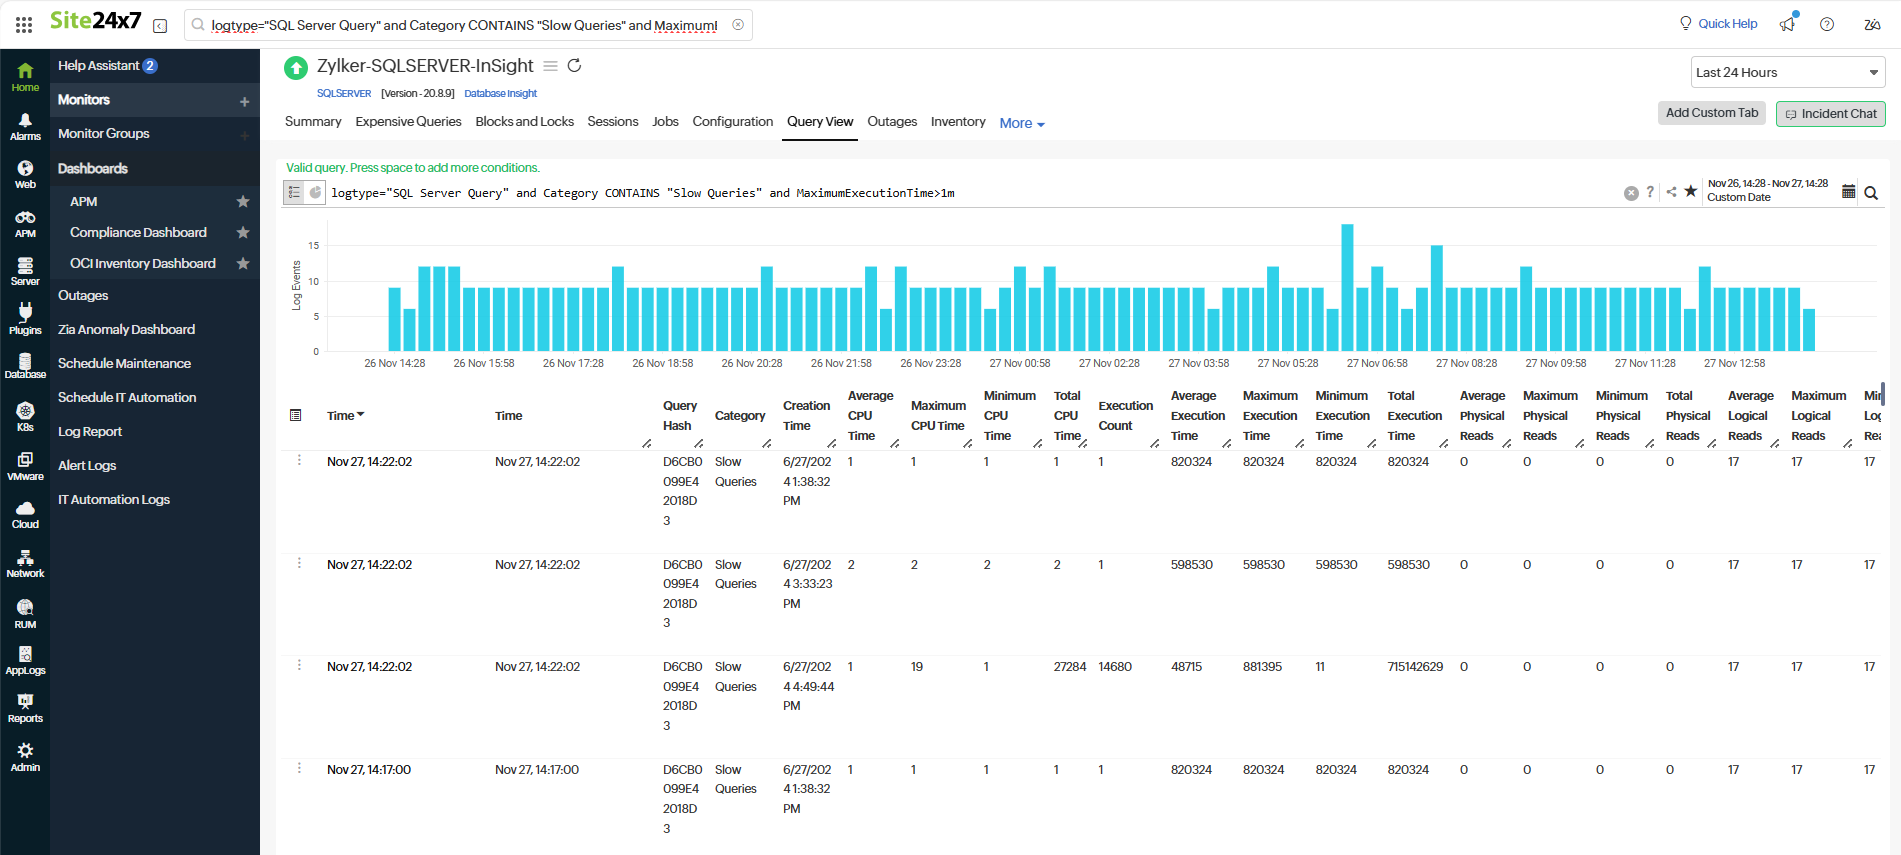
Tracking slow queries with maximum execution time will enable you to pinpoint queries that consume excessive resources, hindering overall database performance, and help identify the queries that might be causing application errors or slowdowns. You can easily track them with the Query View.
For example, it is ideal for a query to execute within a one-minute time interval. If you want to track the slow queries where the maximum execution time is greater than one minute, input the below search query:
logtype="SQL Server Query" and Category CONTAINS "Slow Queries" and MaximumExecutionTime>1m

Tip 2: Tune slow queries based on ideal standards to lower operational costs
Tracking slow queries where the average execution time is greater than 50 seconds will help identify slow queries that take more than 50 seconds for execution to prevent potential bottlenecks, reduce the risk of system slowdowns or crashes, and enhance the overall database performance. This reduces the computational resources required, leading to lower operational costs.
If you want to track the slow queries where the average execution time is greater than 50 seconds, input the below search query:
If the average execution time is greater than 50 seconds, use 50s, or if it is 1 minute, use 1m in the time duration.
logtype="SQL Server Query" and Category CONTAINS "Slow Queries" and AverageExecutionTime>50s

Tip 3: Group queries by query hash value for better visibility
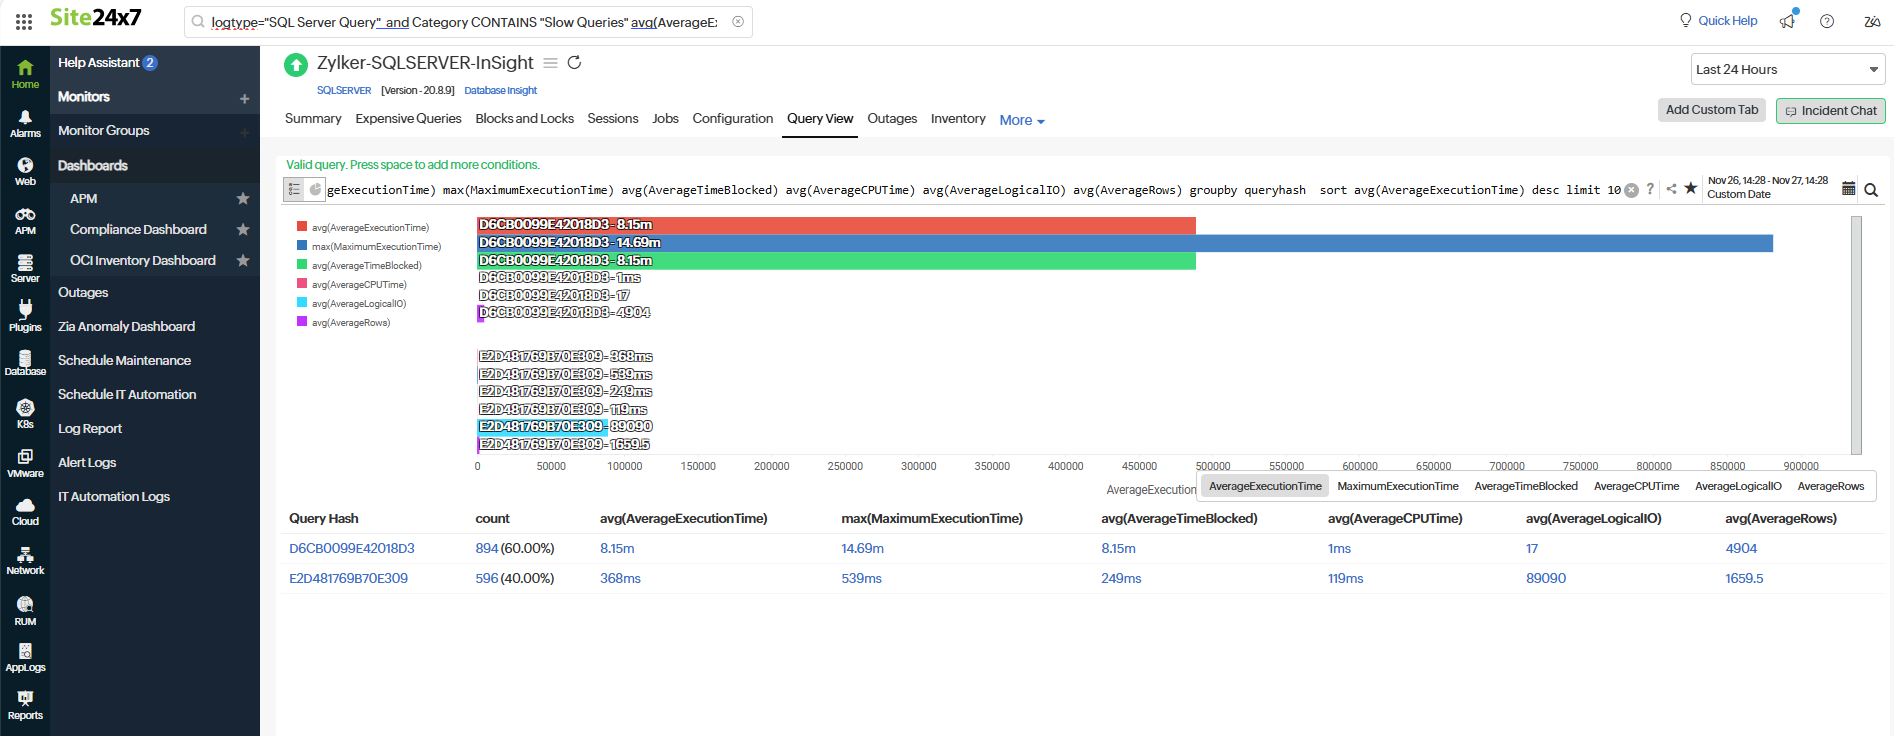
Grouping queries by their query hash enables you to identify duplicate queries, know the exact number of times the query is executed, help pinpoint problematic queries, and simplify query management.
If you want to group the queries by the query hash value, input the below search query:
logtype="SQL Server Query" and Category CONTAINS "Slow Queries" avg(AverageExecutionTime) max(MaximumExecutionTime) avg(AverageTimeBlocked) avg(AverageCPUTime) avg(AverageLogicalIO) avg(AverageRows) groupby queryhash sort avg(AverageExecutionTime) desc limit 10

Likewise, you can customize the view to track the queries with specific cases.
This is one of the ways to track the slow queries in Microsoft SQL so that the queries are optimized to perform operations smoothly.
Bonus tip:
After getting the desired data, you can share the slow query reports to your database admins for further investigation by using the Share option in the top banner. This option lets you choose to export it as a CSV file, which will fetch all the data for that query.
Is this enough?
Nah.
To maintain a database at its peak performance and proactively prevent bottlenecks, it is ideal to track your database 24x7. You can do it at ease with Site24x7.
What do you get from Site24x7 SQL Insight monitoring
SQL Insight Monitoring in Site24x7 provides a thorough insight into the SQL database, which helps the database admins (DBAs) and the IT operations teams identify and pinpoint issues or delays and optimize the database for healthy functioning.
Performance monitoring:
With Site24x7, you can monitor your query performance in real-time and identify slow and expensive queries that can cause application slowdowns.
Real-time and customizable alerts:
You can customize thresholds and receive alerts through SMS, email, or various other third-party tools, such as Slack, Jira, Zapier, ServiceNow, and Microsoft Teams.
Dashboards and reports:
Site24x7 Microsoft SQL database monitoring provides in-depth dashboards that help you view the top consuming components across instances and reports that clearly indicate your database's health and performance. The SQL Insight dashboard is our customers' favorite. It offers real-time, in-depth information about the above-mentioned key indicators of your database health.
Thus, by tracking your database instances with Site24x7, you will reduce downtime and database failures and improve response time and the overall user experience.
If you have questions, feel free to contact [email protected].