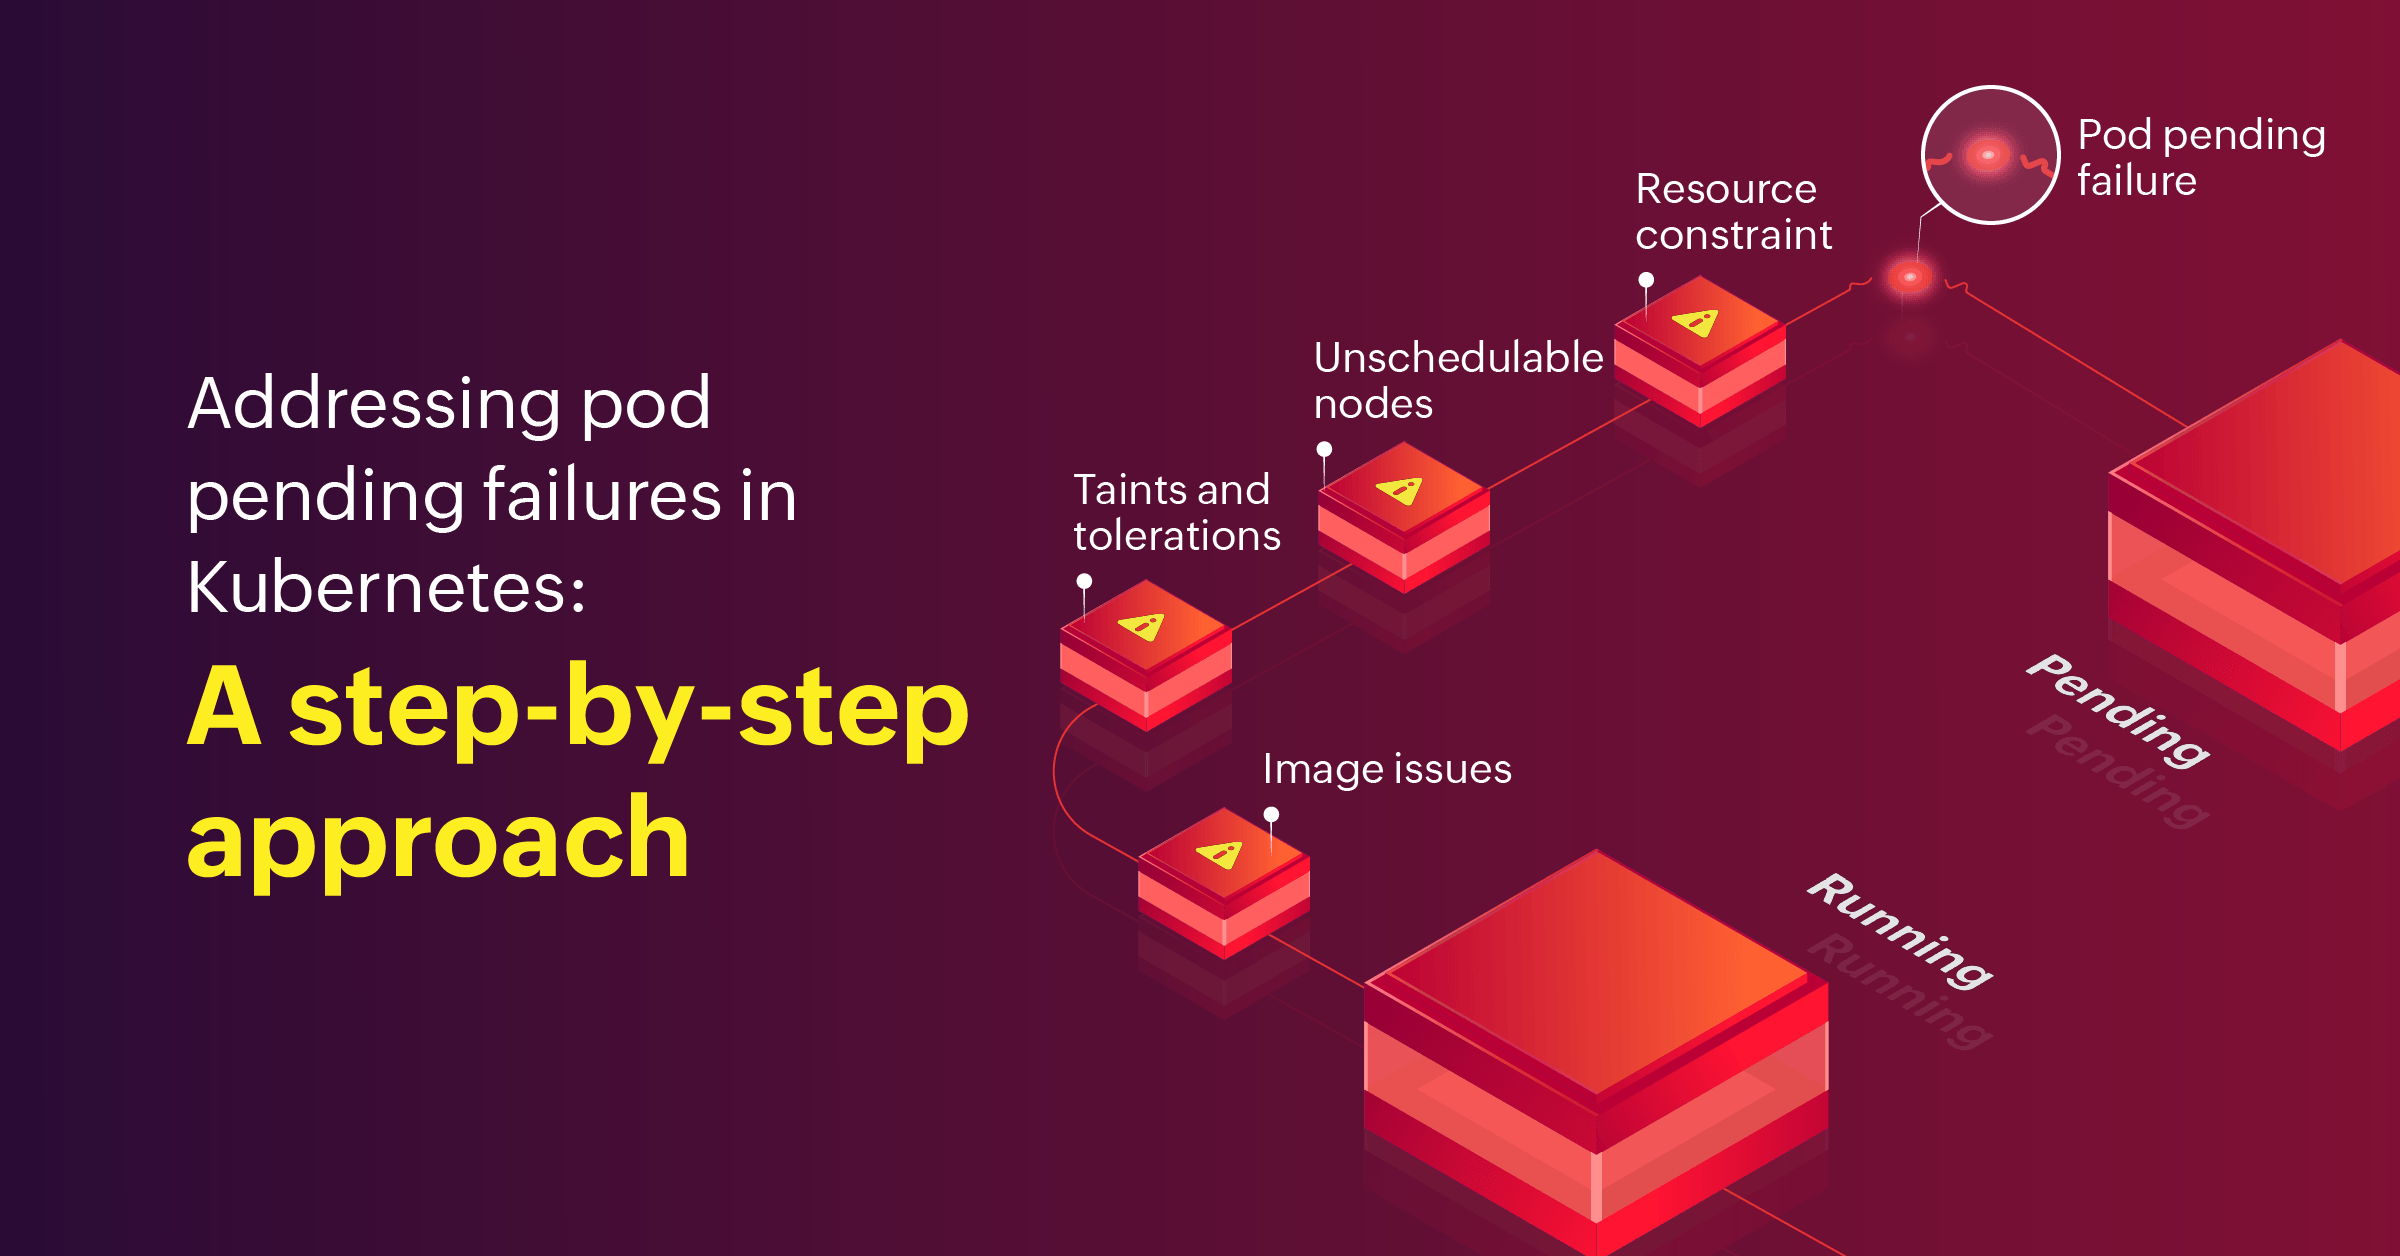
Debugging Kubernetes pod pending failures
Every pod has its purpose. During an application deployment, all the workloads in the cluster work cohesively and ensure that the deployment launches—without any hiccups.
When a pod is created, it starts its lifetime in a Pending state. A pod is in the Pending state when it is still in the process of being scheduled for deployment. When it...
The role of AI in Kubernetes monitoring
In a dynamic environment like Kubernetes, where manual tracking is impossible, AI-powered monitoring tools, such as Site24x7, surf through enormous amounts of data, detecting irregularities, predicting vulnerabilities, and alerting the user about a possible outage that is about to happen if the resource is not handled.
Proactive identification o...
Identifying performance bottlenecks in complex applications
Performance bottlenecks can sneak in and slow everything to a crawl regardless of how advanced your application is. These hidden culprits can turn a seamless user experience into a frustrating one. In this blog, we’ll uncover the most common bottlenecks that drag down complex applications and share proven strategies to identify and resolve them....
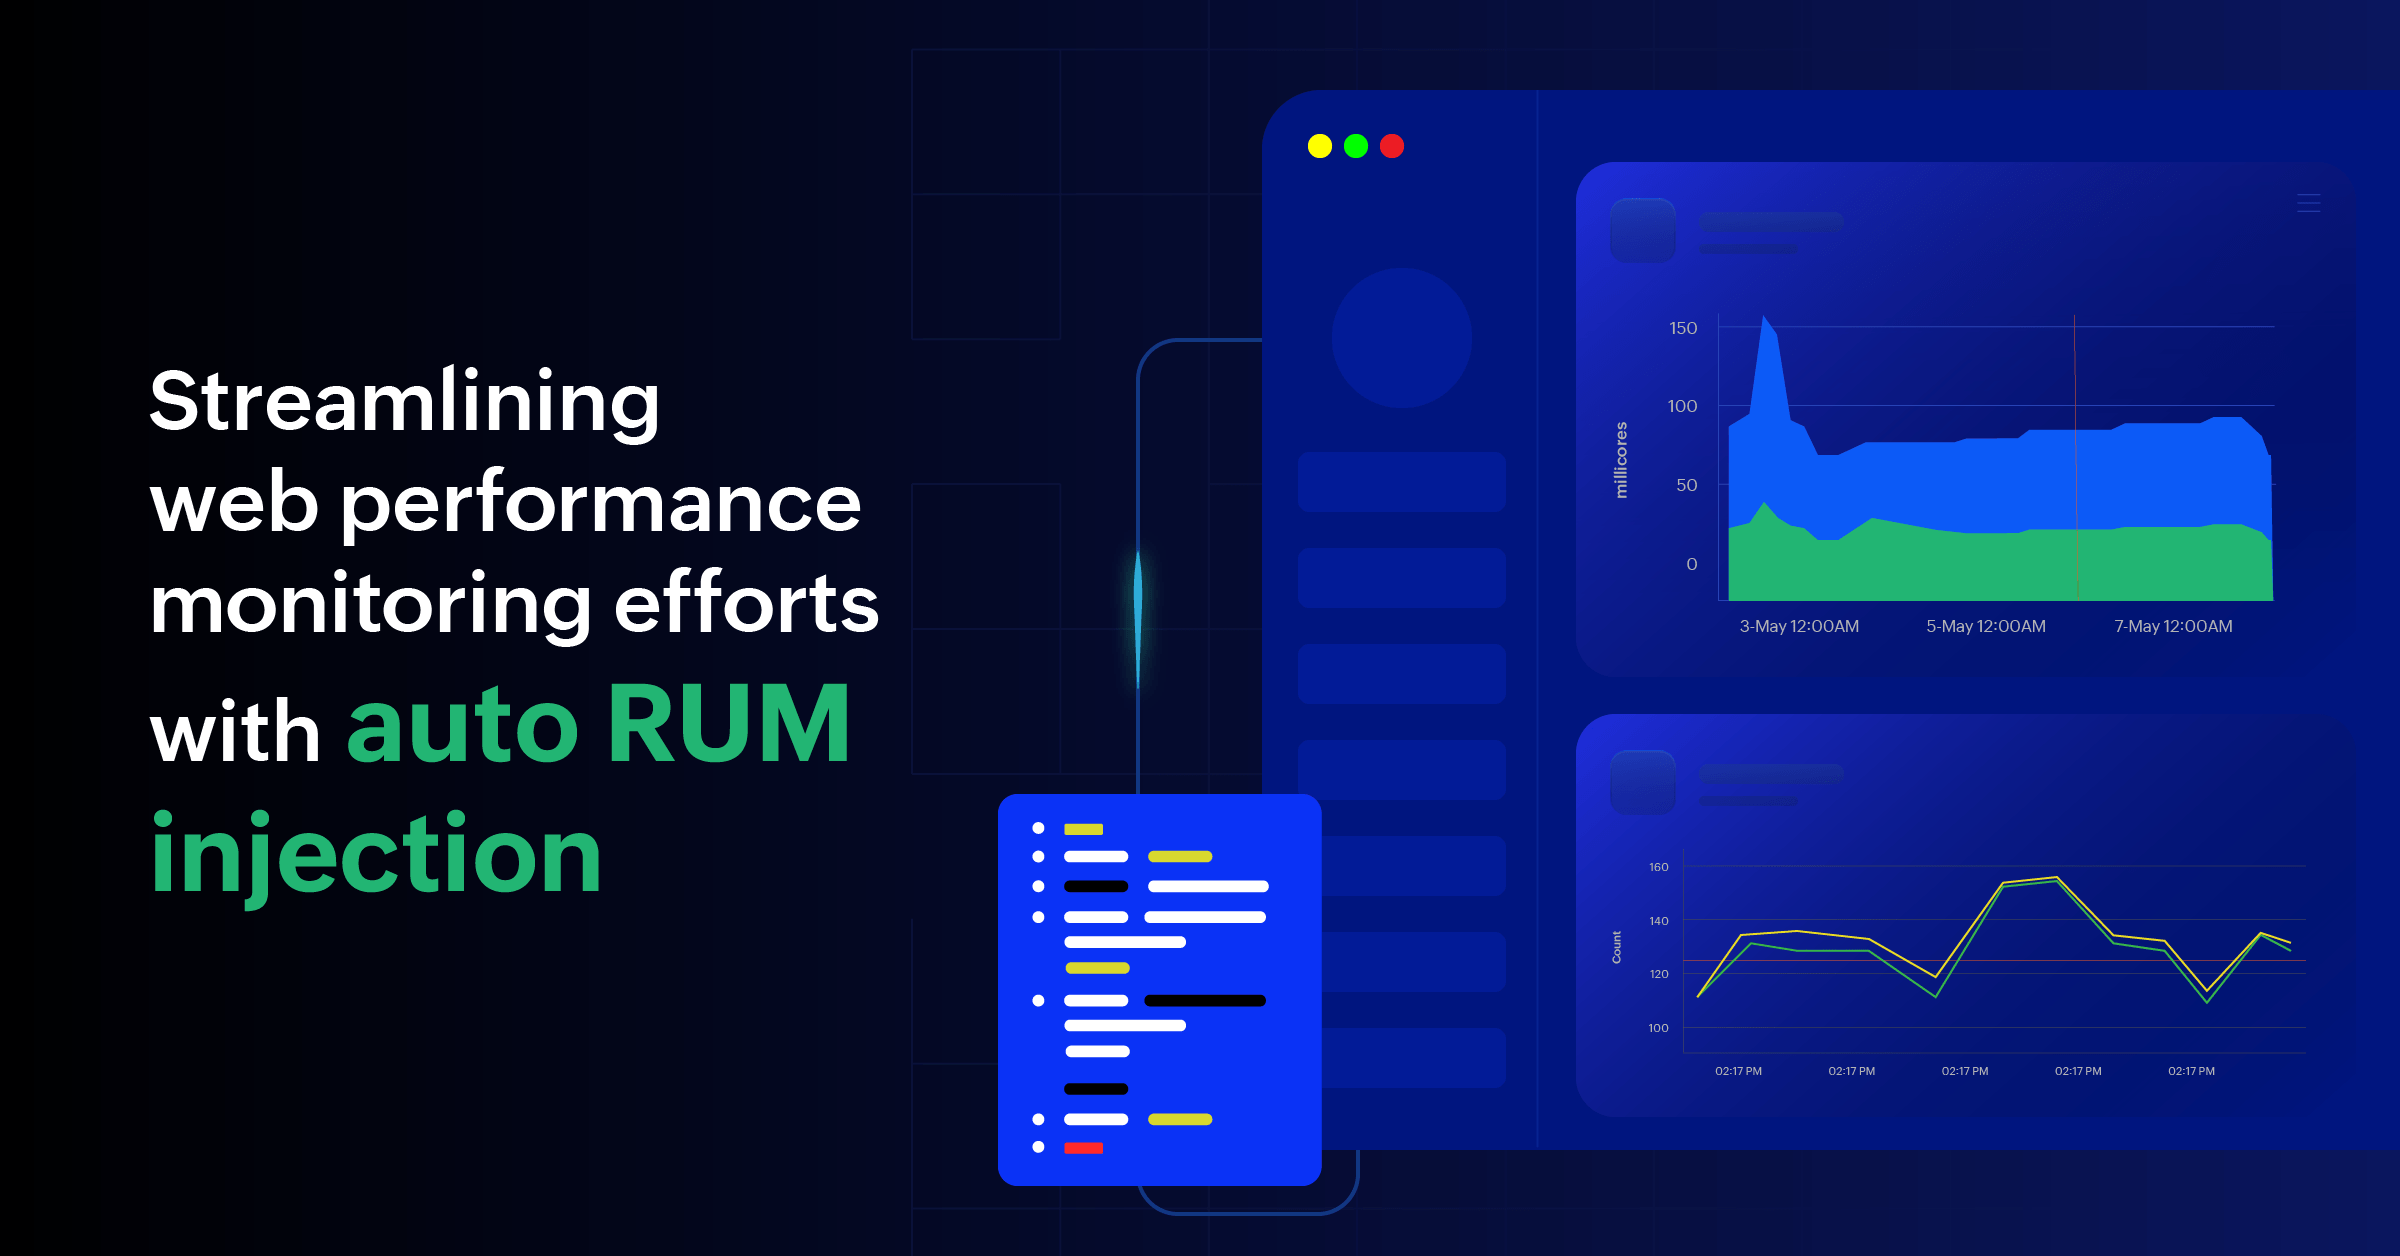
How can you simplify web performance monitoring with auto RUM injection
Real user monitoring (RUM) is a powerful tool for optimizing the end-user experiences of web applications. With insights into performance, load times, user behavior, and more, RUM enables businesses to identify and address issues that negatively impact user satisfaction.
Consider a scenario where a growing e-commerce company experiences peri...
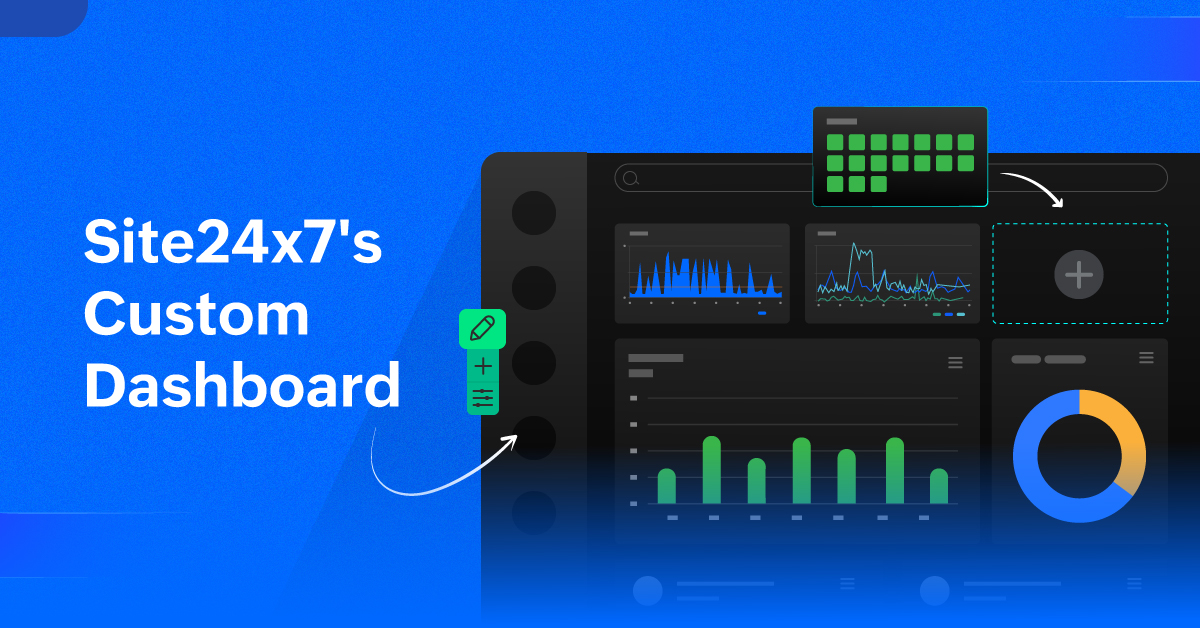
Transform your monitoring experience—Site24x7's Custom Dashboard
The dashboard in Site24x7 provides a solid foundation, but its true potential is unlocked through customization. Custom Dashboards enable you to personalize your monitoring experience, focusing on the metrics that matter most to you. By incorporating a variety of widgets, you can create a tailored and comprehensive view of your system's performa...
Introducing Site24x7's OCI Monitoring: Optimizing Oracle Cloud Infrastructure
Today, we’re excited to announce Site24x7’s latest integration with Oracle Cloud Infrastructure, a comprehensive solution to enhance control and visibility over your OCI environment. With Site24x7's advanced monitoring capabilities, you can track your cloud resources in real time, ensuring optimal performance, security, and c...
11 helpful KPIs to improve your network performance
Digitalization has surpassed network modernization, resulting in networks struggling to keep up with daily operations. While many networks can accommodate GenAI and other new technologies, network administrators are responsible for maintaining uninterrupted operations and preventing any errors. For this, they must diligently monitor network perf...
How to monitor ActiveMQ performance metrics to prevent common issues
Monitoring Apache ActiveMQ is essential for maintaining the stability and performance of your messaging infrastructure. As a message broker, ActiveMQ plays a critical role in facilitating communication between different components of IT systems, handling high volumes of messages, and ensuring reliable message delivery. Without proper oversight, ...
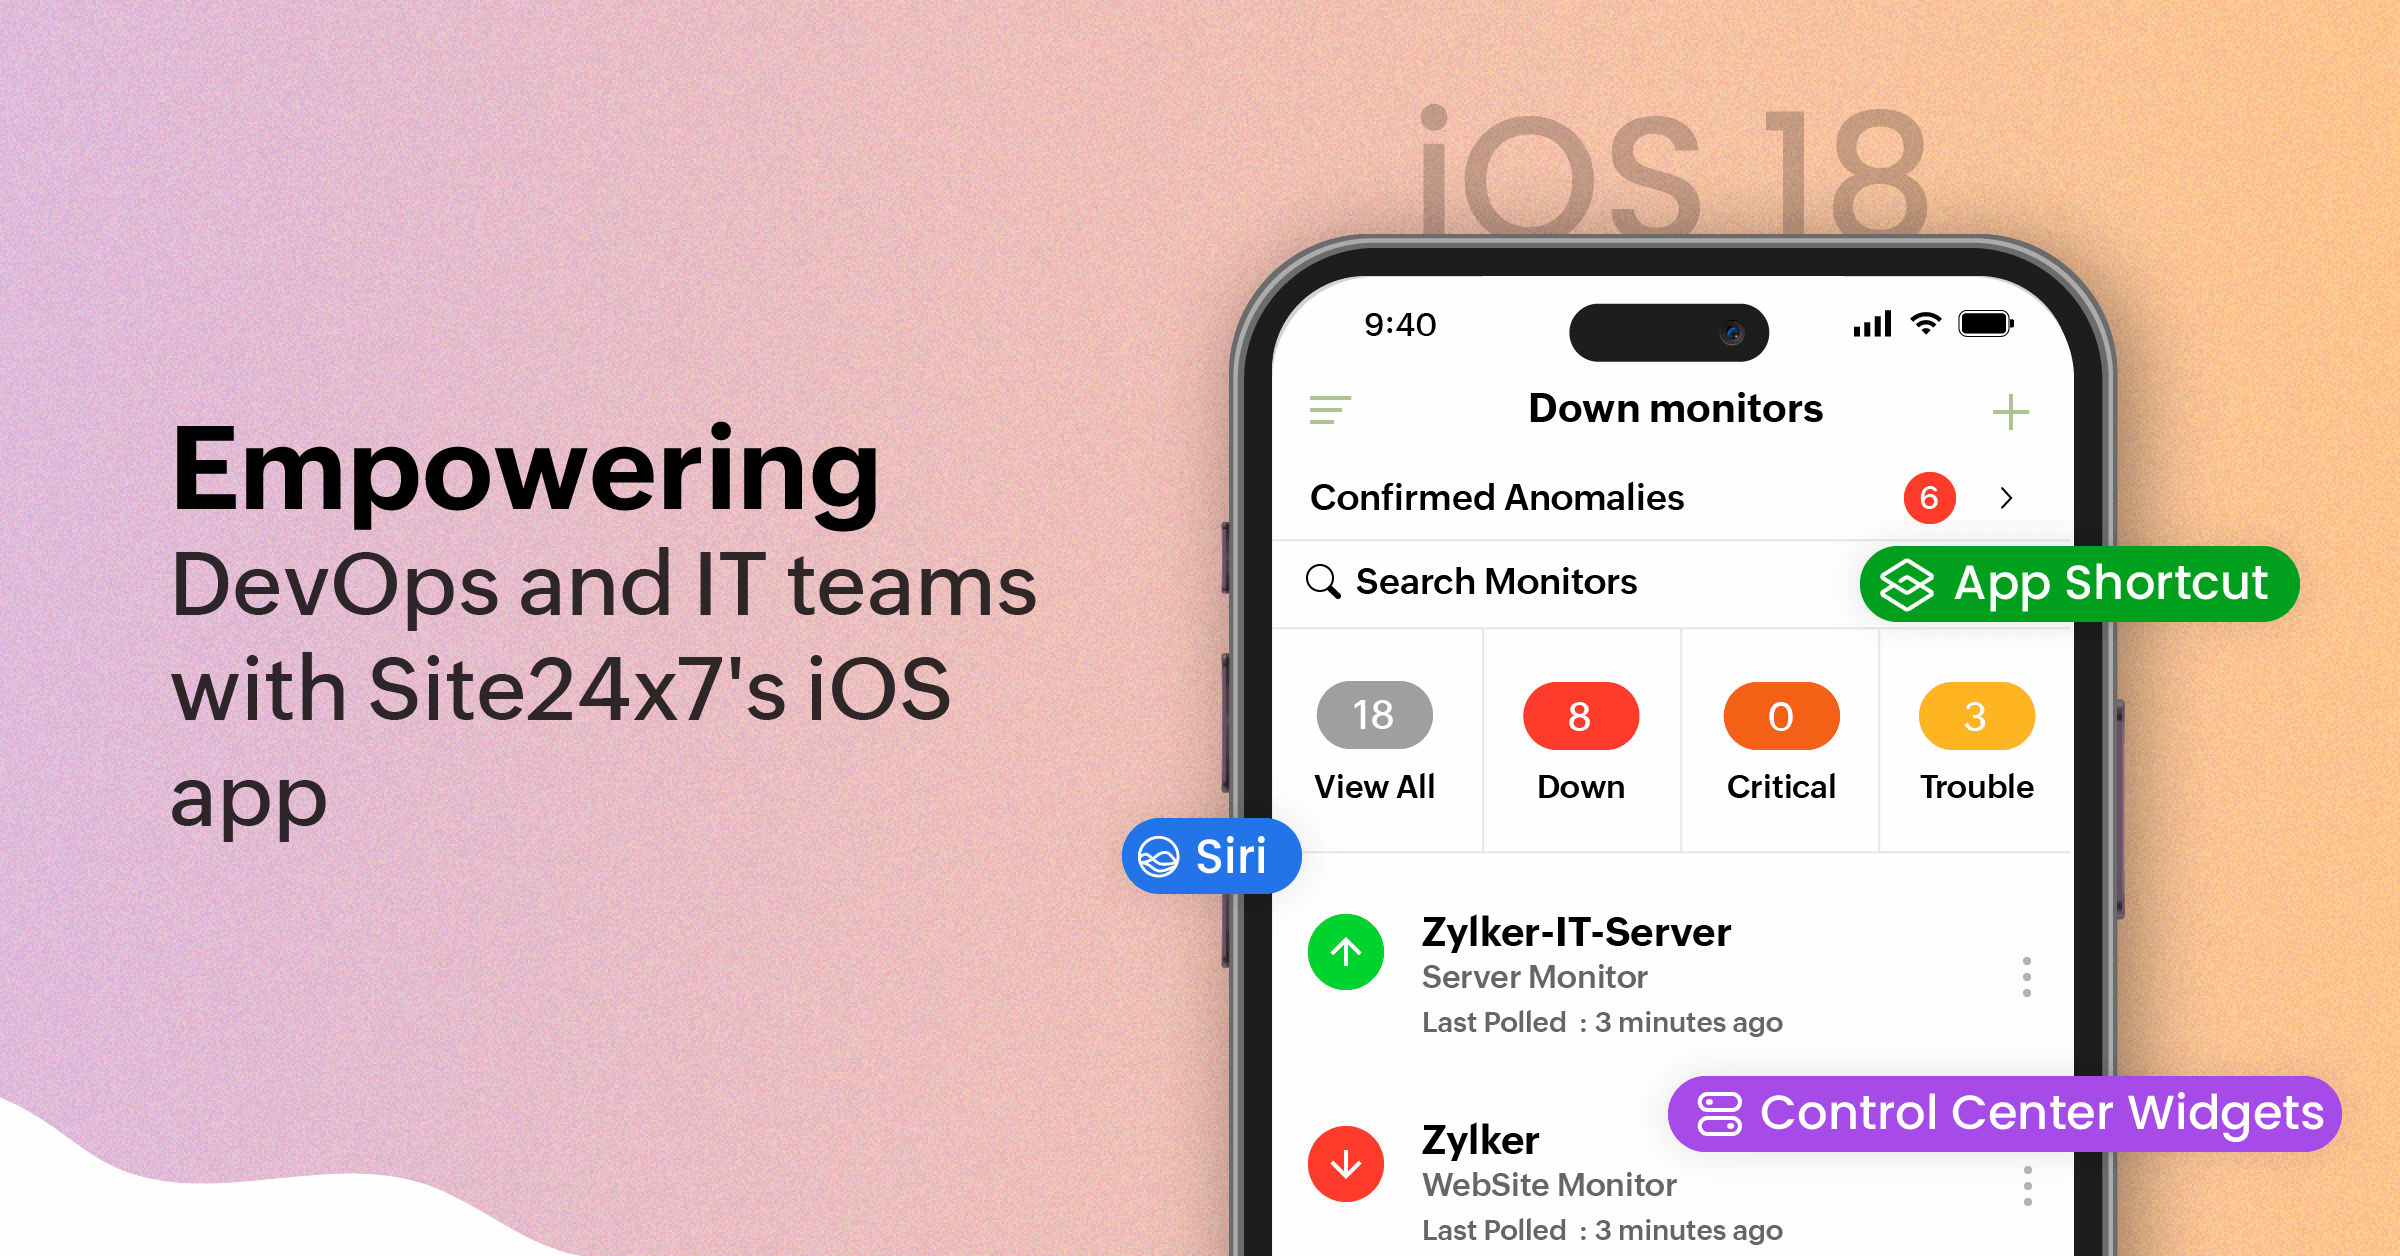
Elevate your IT operations with Site24x7 on iOS 18
Apple has once again redefined the possibilities of mobile technology with the release of iOS 18. With our commitment to stay at the forefront of innovation, we've seamlessly integrated iOS 18's powerful features into Site24x7's mobile app to deliver an unparalleled experience for DevOps and IT teams.
Elevate your IT operations with ManageEngine...
Auto scaling beyond the basics: Fine-tuning AWS Auto Scaling groups
Before diving into advanced techniques, it's essential to have a firm grasp of what Auto Scaling groups are and how they function at a basic level. Auto Scaling groups adjust the number of Amazon EC2 instances required in your application to meet the peak performance demand. They can scale in (reduce instances) or scale out &#x...
