by Deva Priya
Hi there!
We're happy to inform you that Site24x7 Waterfall Analysis is now available for everyone.
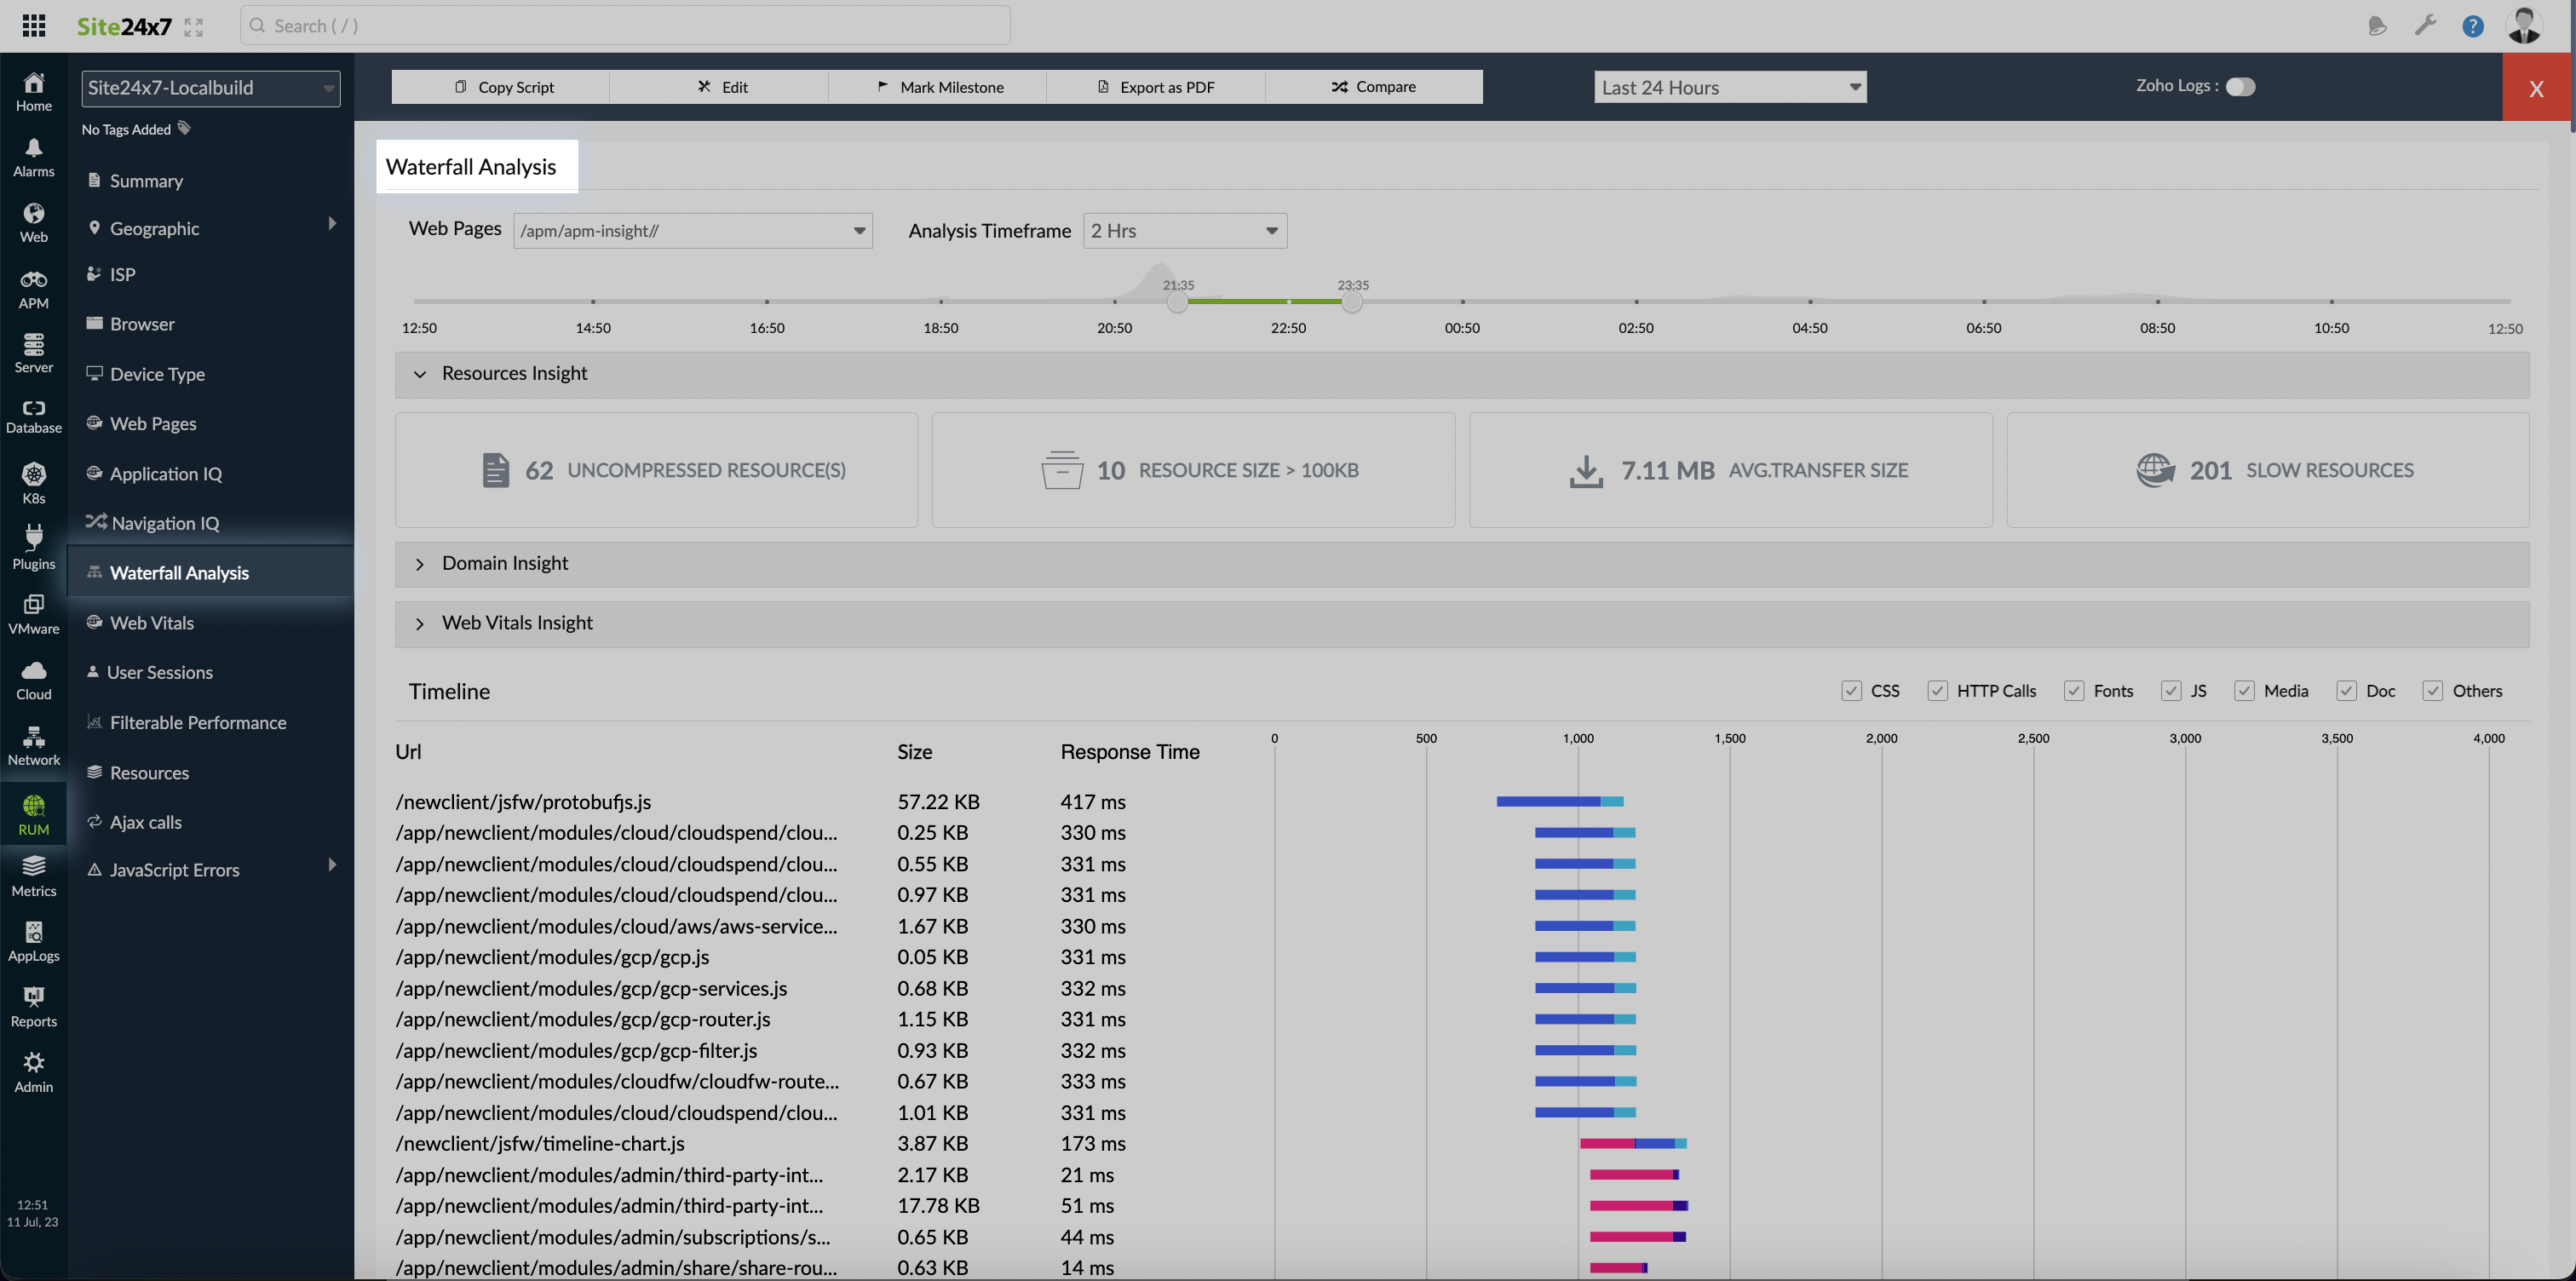
Waterfall Analysis in RUM is an excellent tool for obtaining detailed information about the various resources that comprise user actions. The Waterfall chart provides invaluable insights into the slowest loading requests on a page, helping you determine where to focus on improving the performance of the selected page.
To access Waterfall Analysis for a user action, navigate to RUM > your Application > Waterfall Analysis.
Data Insights from Waterfall Analysis
The Waterfall insights make it simple to understand which web requests have an impact on key performance metrics and are, therefore, potential candidates for optimization. The following insights are captured for easy understanding:
Resources Insight: Uncompressed resources, resources larger than 100KB, slow resources (> 200 ms), and so on.
Domain Insight: First-party, third-party, and CDN domains.
Web Vitals Insight: LCP, FCP, CLS, and FID.
Waterfall chart
The Waterfall chart displays a list of the requests made to load a page and the time taken by each request. With these timeline bars, you can quickly identify the request that took the most time and also the reason for it using the color code.
Note:
You can also get metrics for the specified webpage, time duration, and from and to range.

Check out our help documentation for more information. Please reach out to [email protected] if you have any questions.
Try Site24x7's Waterfall Analysis feature and leave your feedback in the comments section below.
Happy Monitoring!
Regards,
The Site24x7 team
Like (2)
Reply
Replies (0)