APMInsight-RUM Integration
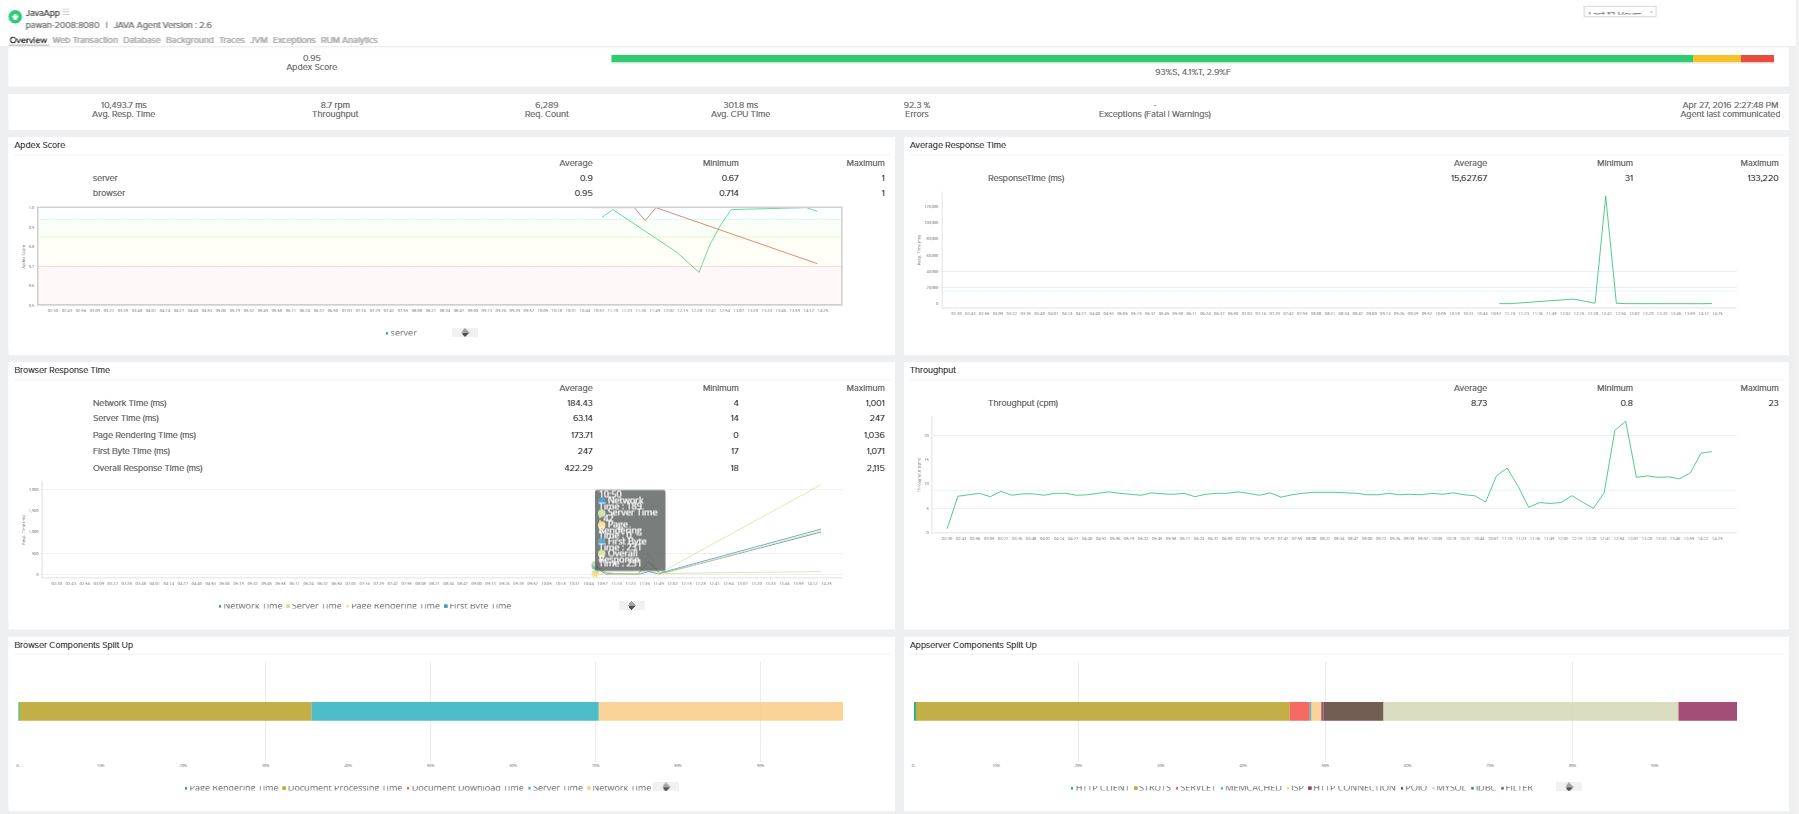
APMInsight and Real User Monitoring (RUM) is contextually integrated and the holistic picture of an application's performance, can be seen from a single console. i.e., The applications performance, from the click on the browser, to the time taken for displaying the response, along with the backend time taken in processing the transaction, is all captured and displayed in a single console. Browser time and the Server time is integrated and thus helps in analyzing the metrics together and improve the performance of the application.

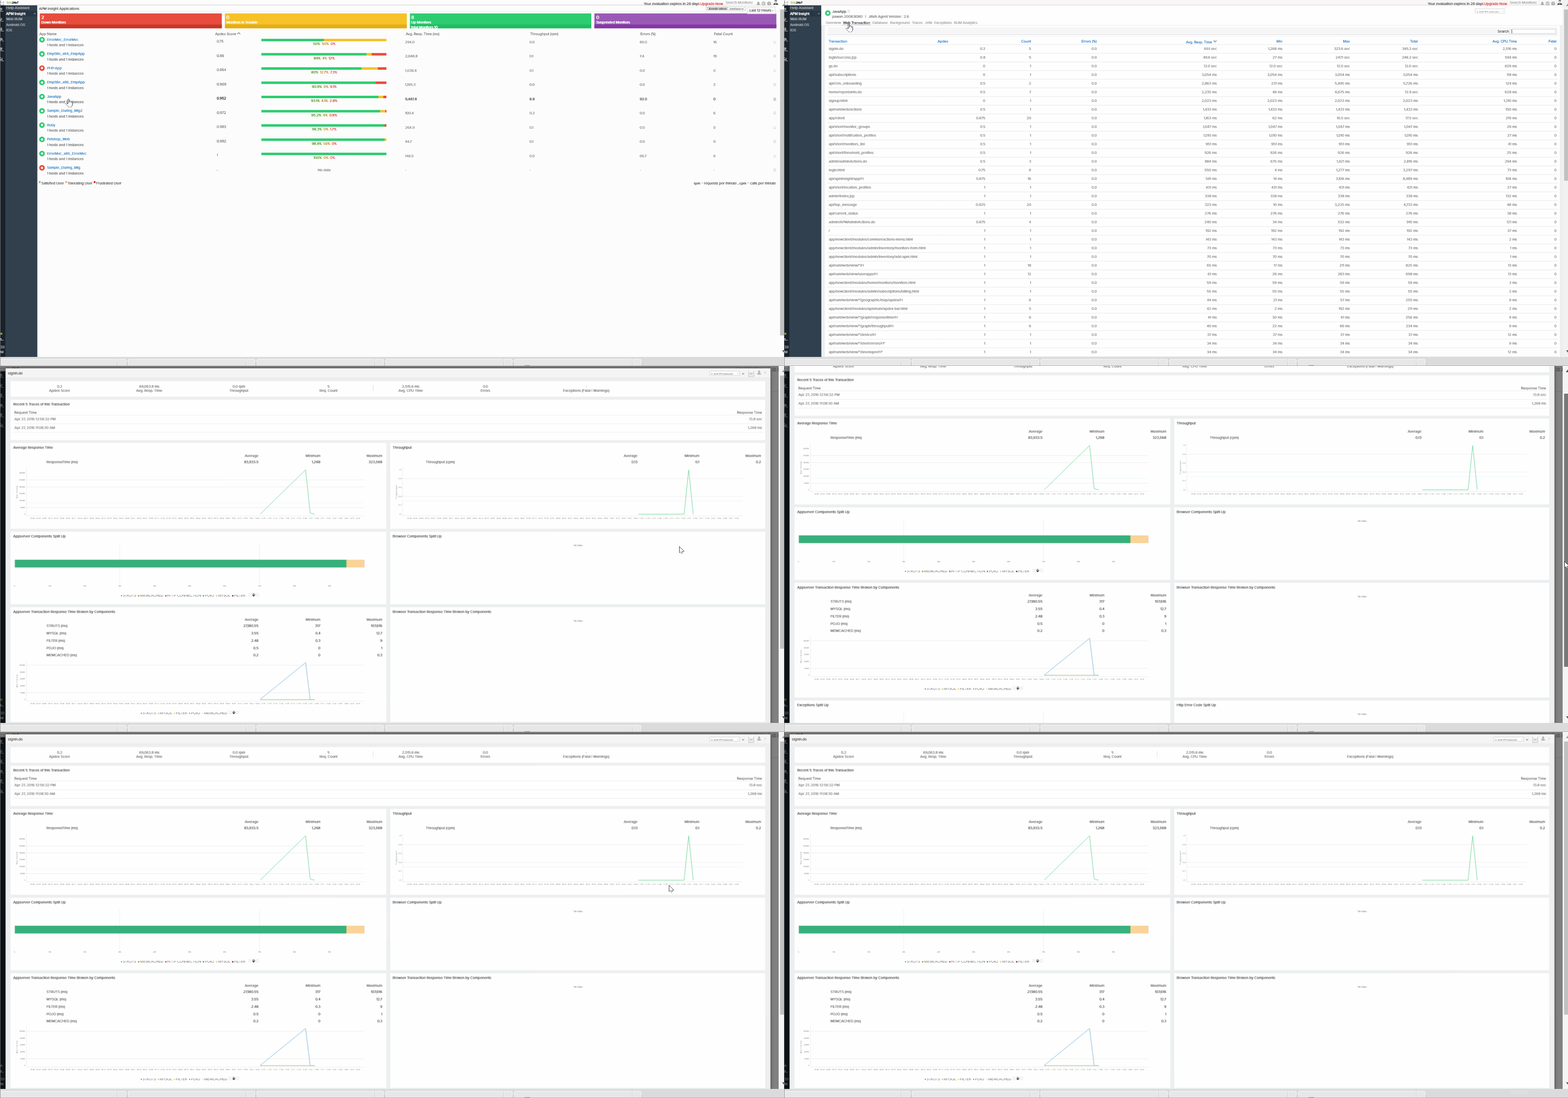
Along with application level metrics, individual transactions performance is also tracked from browser click to browser display of response. This will help in getting the exact split of the transactions response time and will help in fine tuning and identifying the root cause of a transactions behaviour.

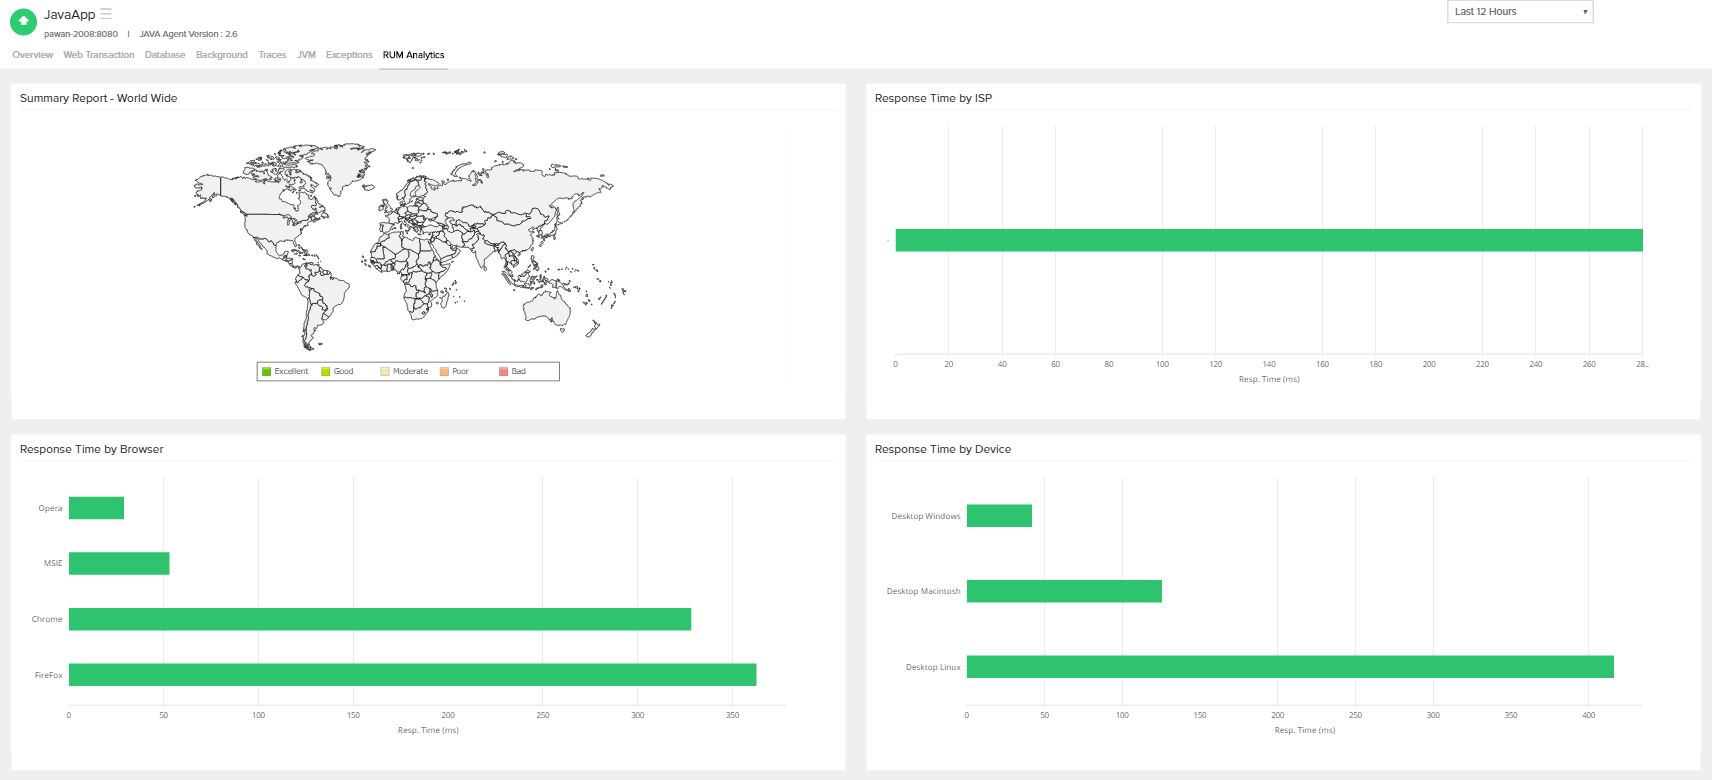
Also, the application level analytics based on Country, ISP, Browser and Device data can be viewed at one shot.

Mapping / Adding a RUM application from APMInsight is self explanatory and easy/simple to do it.
