Performance Metrics of FTP Server Monitor
Interpret FTP Server Monitoring Results
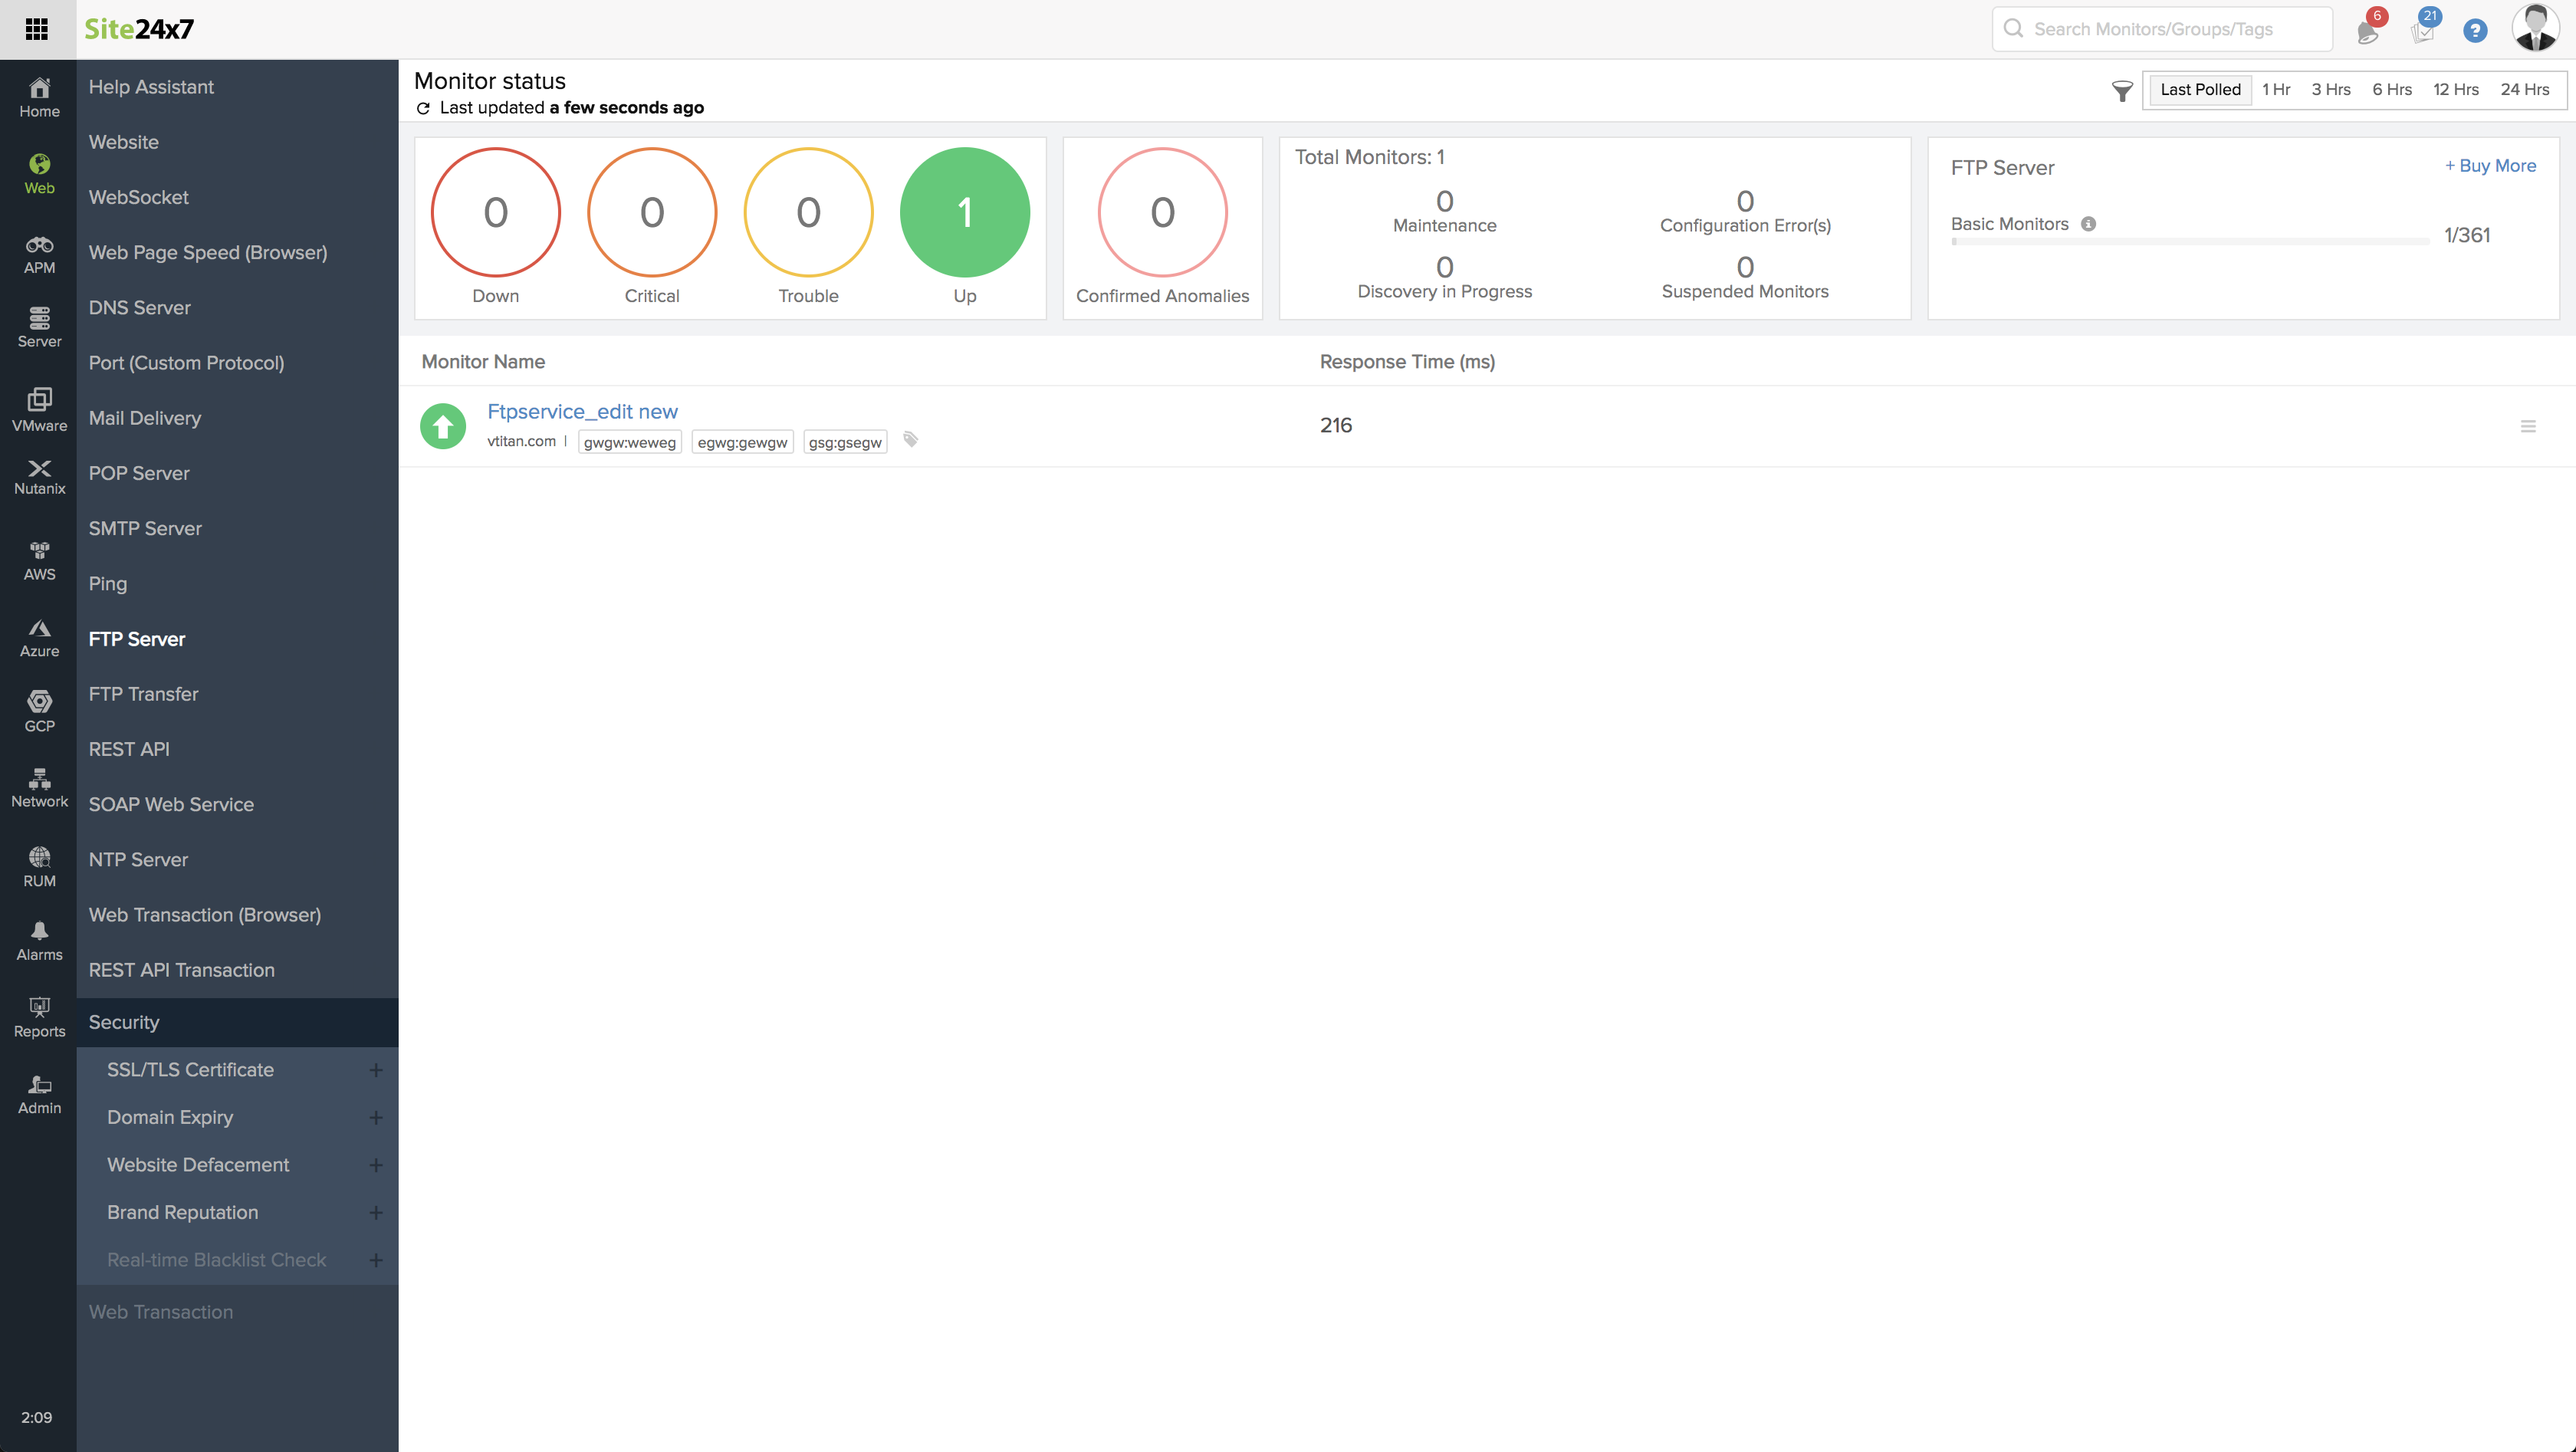
Site24x7's web dashboard has a custom status banner, which identifies the various configured monitors by segregating them based on their operational status and state. You can also view the number of operational monitors and alert credits remaining in your account. By clicking the "+ Buy More" button, you can purchase additional monitors and alert credits. To read the monitoring results of your FTP Server Monitor, navigate to Web icon and click the appropriate FTP Server monitor in the web dashboard. You can share the monitor details via an email. Email can be sent to only those verified users who have agreed to receive emails from Site24x7.
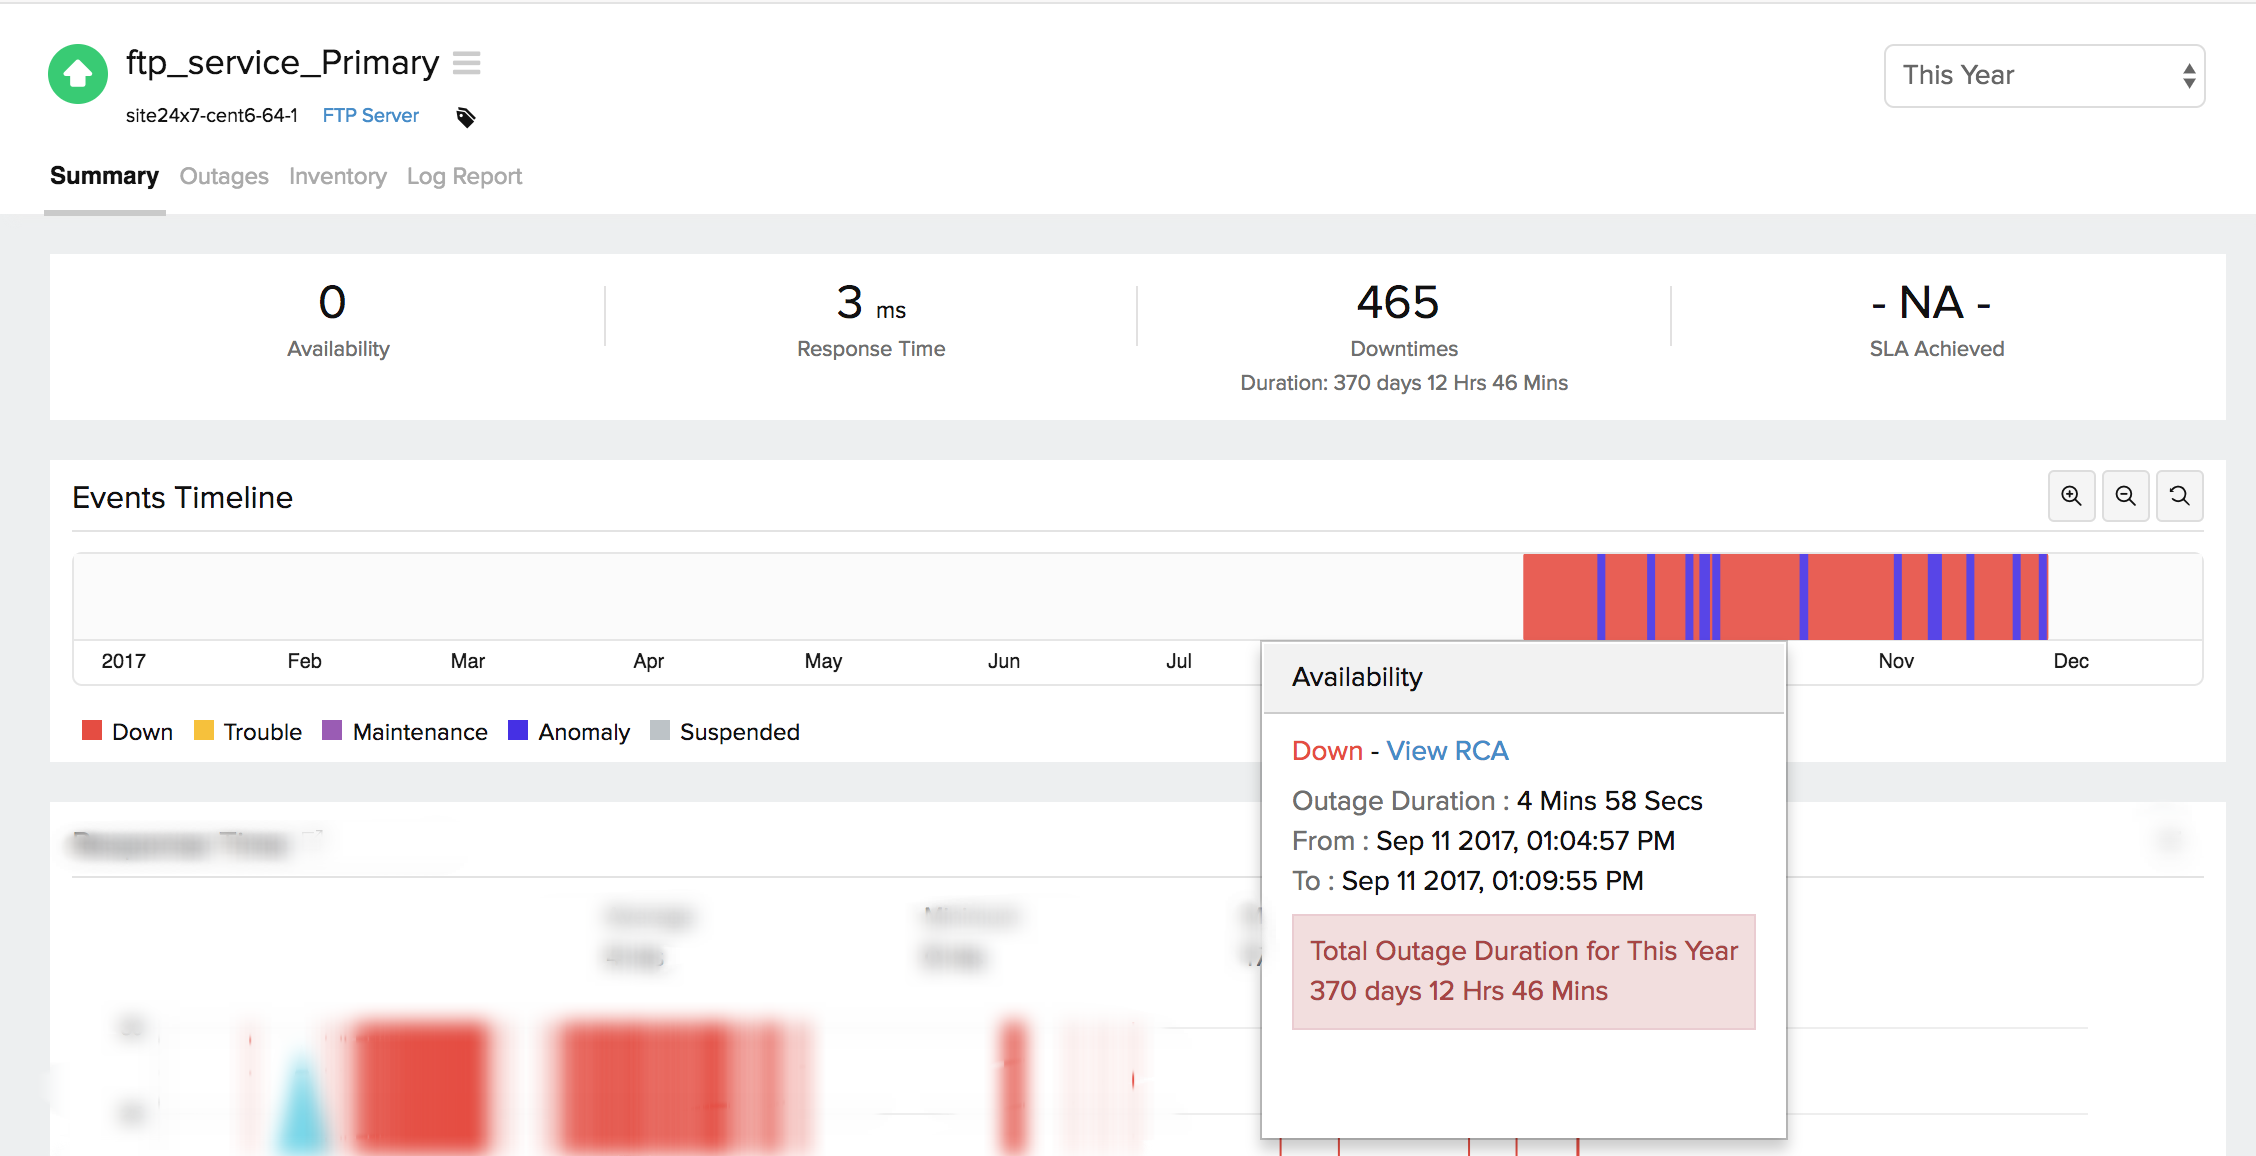
Events Timeline
Events timeline widget records all the past events of your selected monitor for a selected time range. You can identify/decode various events from the past, which includes Down, Critical, Trouble, Maintenance, Suspended, or Anomalies. Each event are color coded for easy identification. Events can be drilled down to extract maximum data and facilitate easy troubleshooting. You can also track the actual outage period and the total outage duration during a specific block of time.
The results will be displayed under two main headers; Response Time and Availability and Response Time by Location.
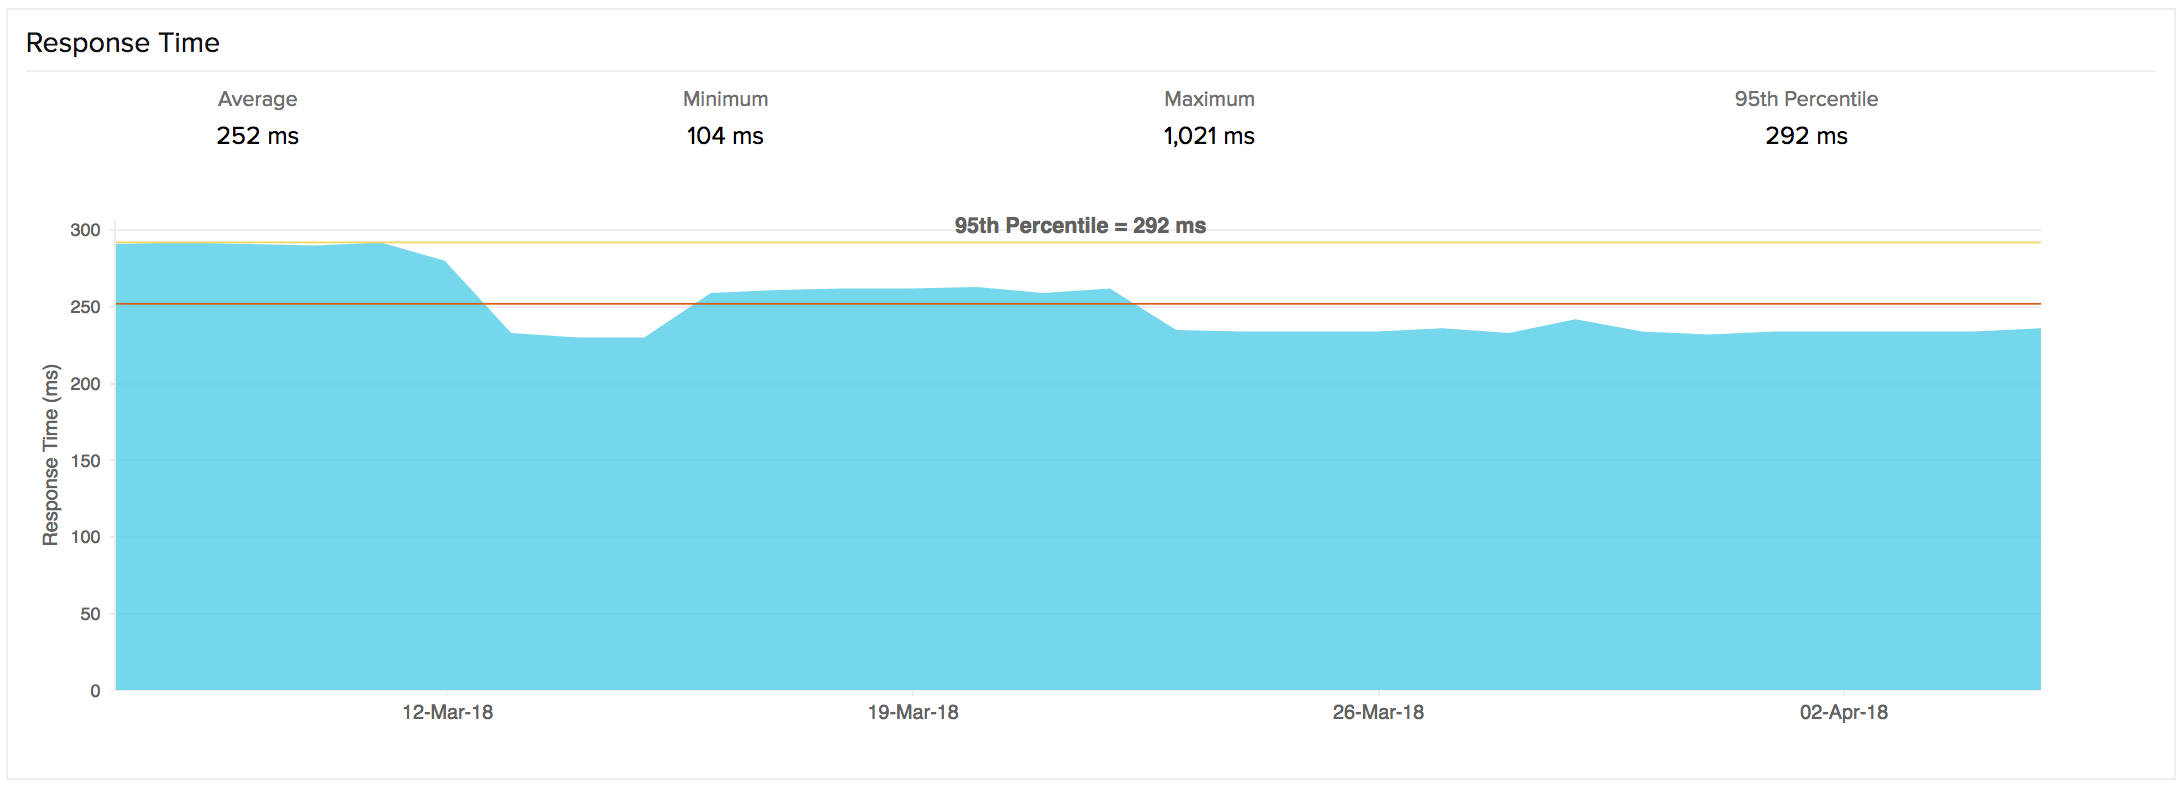
Response Time
Response Time denotes the total time taken by Site24x7 servers to connect to your FTP host through the specified port. The graph is computed by plotting time period against response time.
Response Time by Location
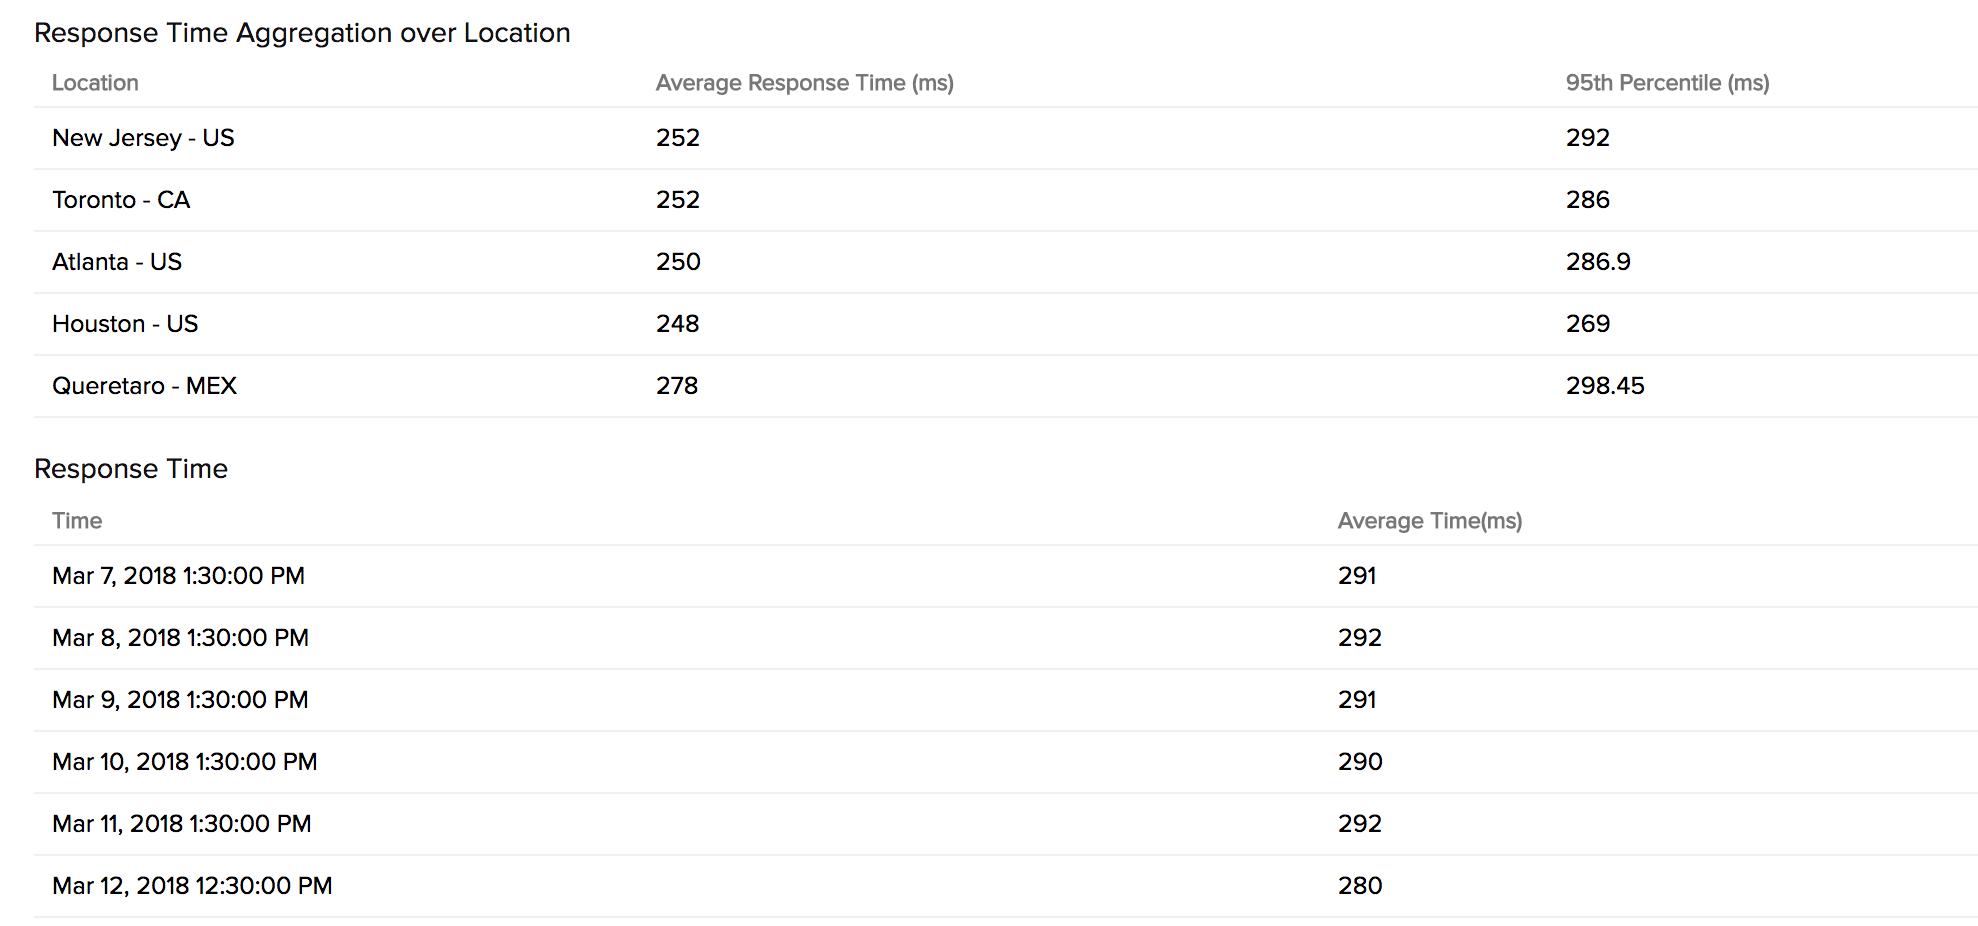
Response Time by Location graph shows the average/95th Percentile response time for each day or hour from each monitoring location. This can be used to check the average/95th Percentile response time of your monitors from different monitoring locations. Location legend is given with the graph. The legends act as manual filters. You can filter out the response time of specific locations using these.

Table view
Average Response Time and Average/95th Percentile Response Time by Location is shown in detail in the table format.
Outages
You can access the Outages tab in your monitor's details page to gather detailed insights on the various outage and maintenance downtimes. It provides you with sufficient information to troubleshoot issues. You'll also be able to access the root cause analysis reports for your various outages. On accessing the ![]() icon of a listed monitor outage or maintenance, you'll be shown the options to:
icon of a listed monitor outage or maintenance, you'll be shown the options to:
- Mark as Maintenance: Mark an outage as Maintenance
- Mark as Downtime: Mark a Maintenance as Downtime
- Edit Comments: Add/Edit Comments
- Delete: Delete an Outage/Maintenance permanently
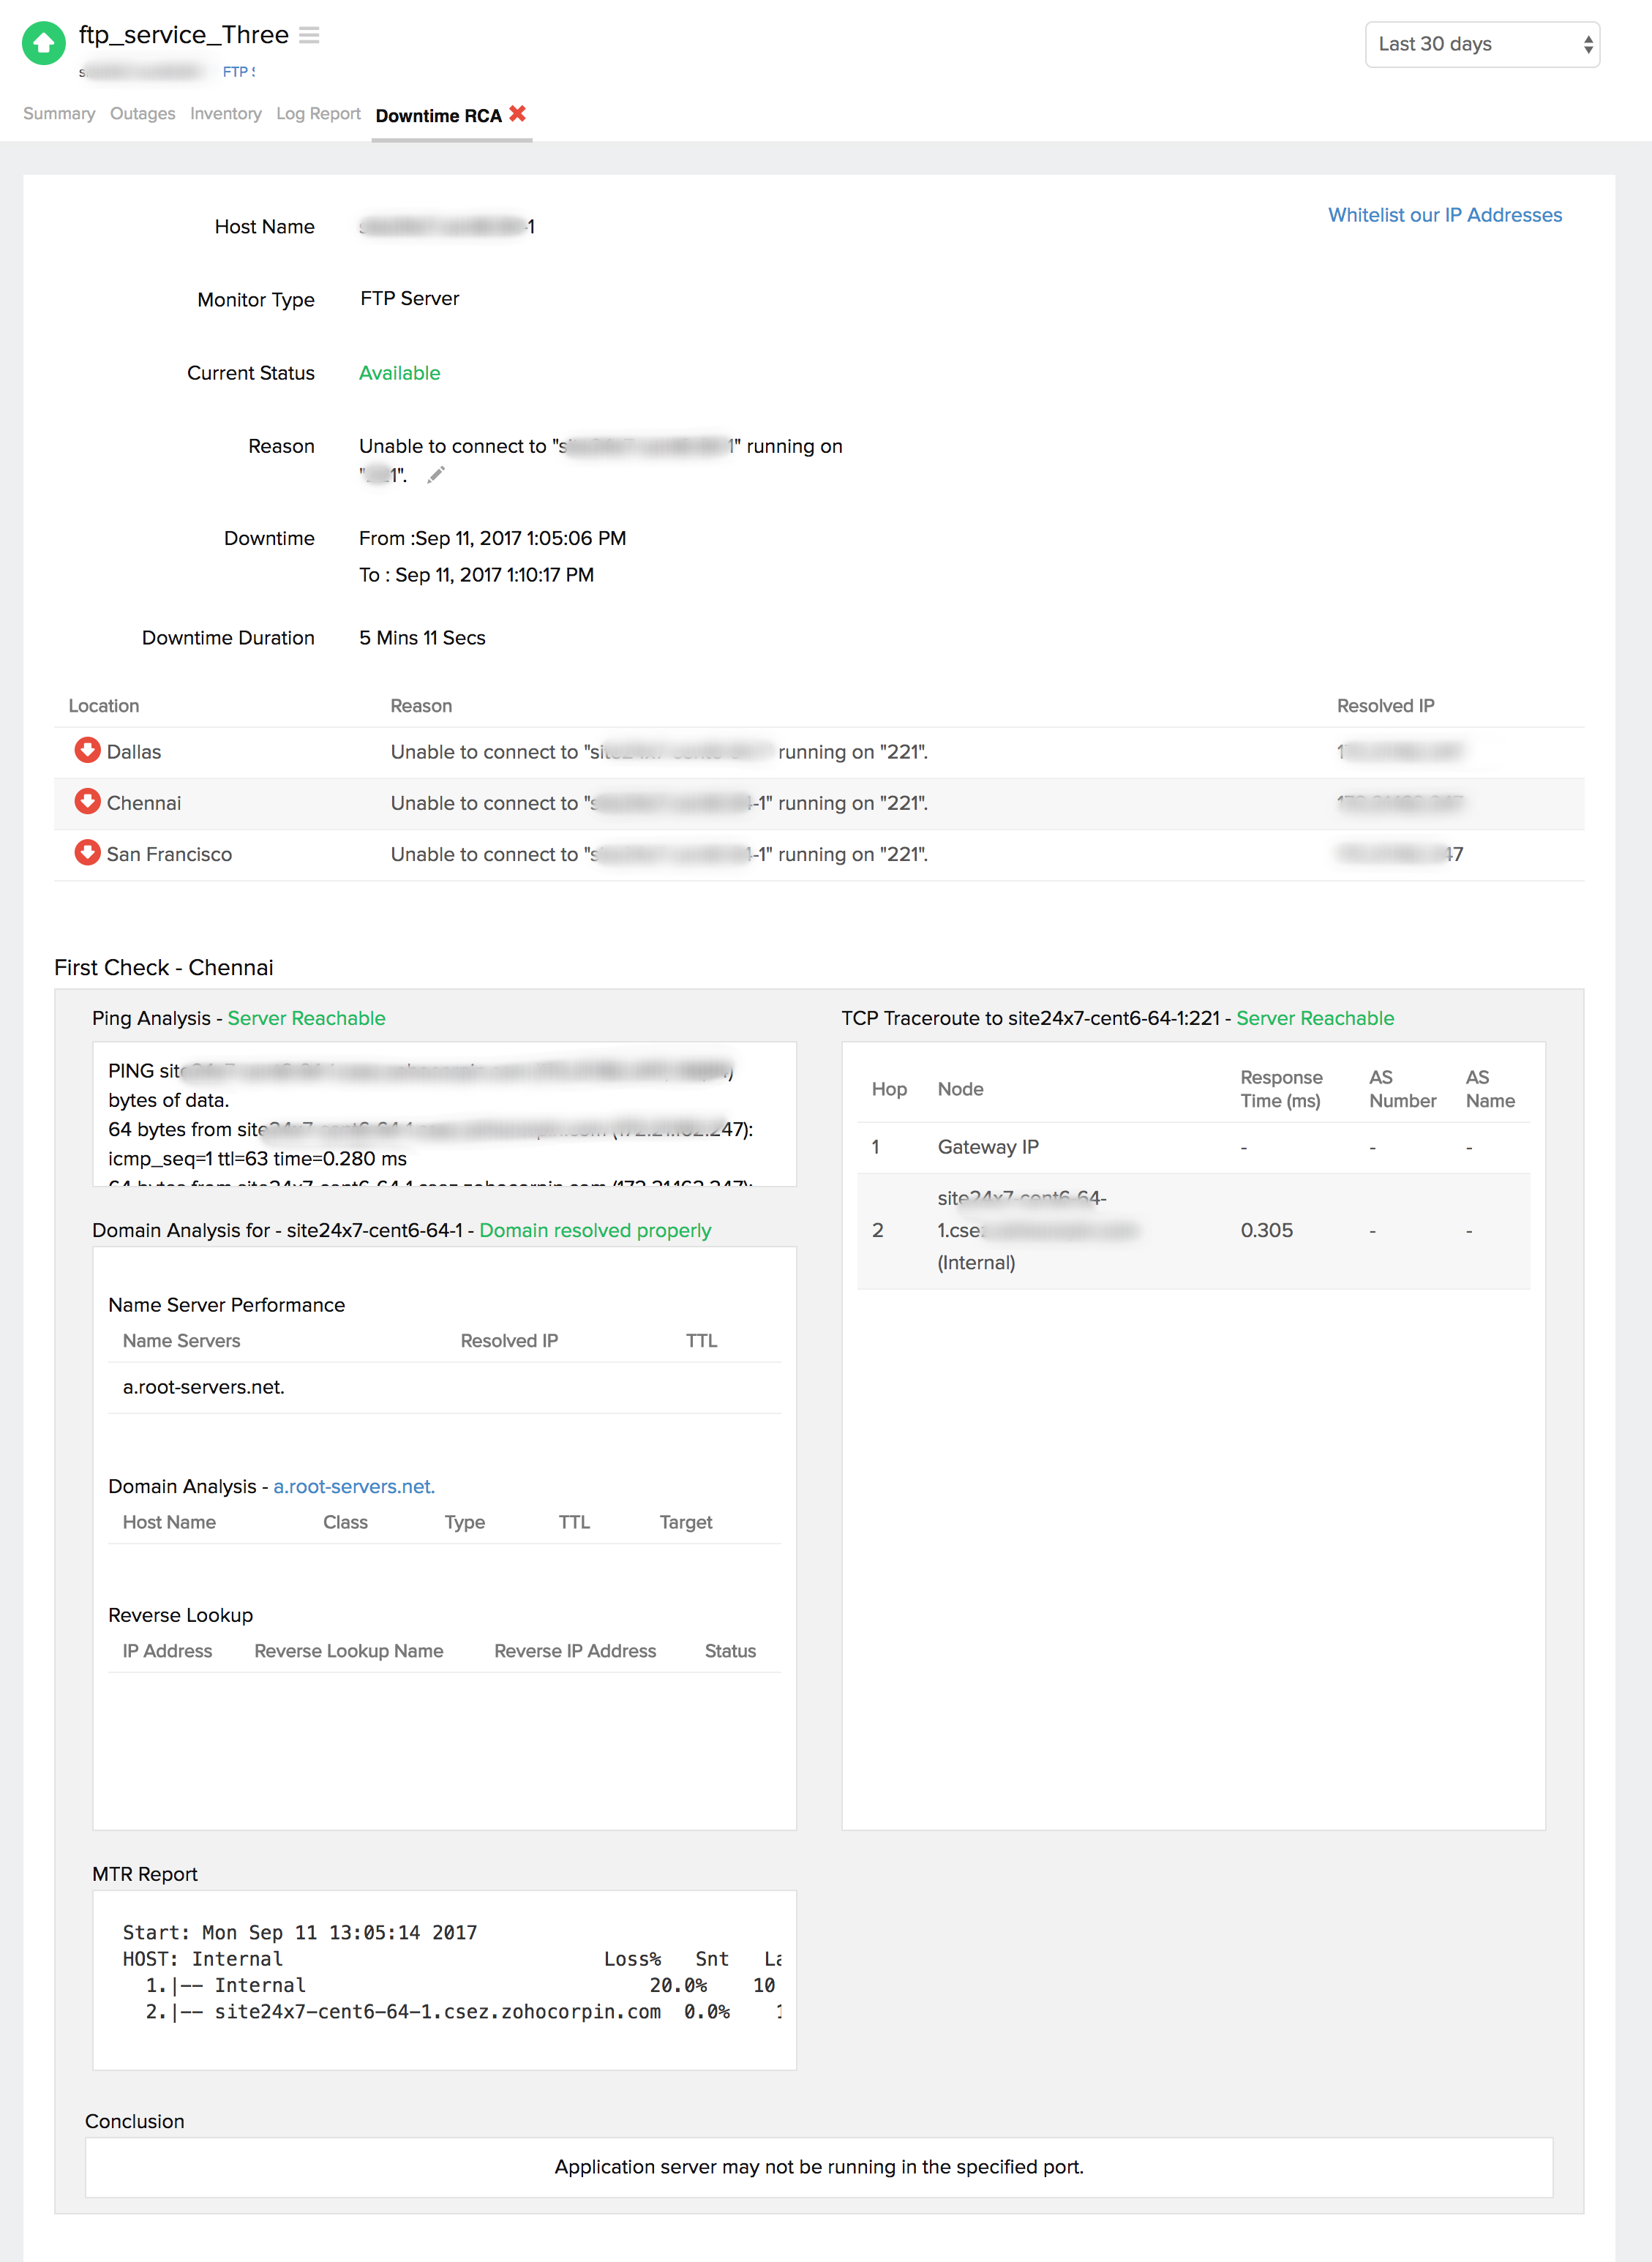
Root Cause Analysis (RCA) Report
You can retrieve indepth root cause analysis report for your DOWN monitors after 150 seconds of the monitor reporting the outage. RCA Report gives basic details about your monitor, outage details, recheck details and reasons for the outage. Root Cause Analysis automatically generates a plethora of information to arrive at a definite conclusion as to what triggered a downtime. RCA intends to determine the root cause of specific downtime or performance issue. A normal RCA report will comprise of the following details:
- Checks from Primary location and re-checks from Secondary location.
- Ping Analysis
- DNS Analysis
- TCP Traceroute
- MTR Report
- MTR based Network Route
- Conclusion
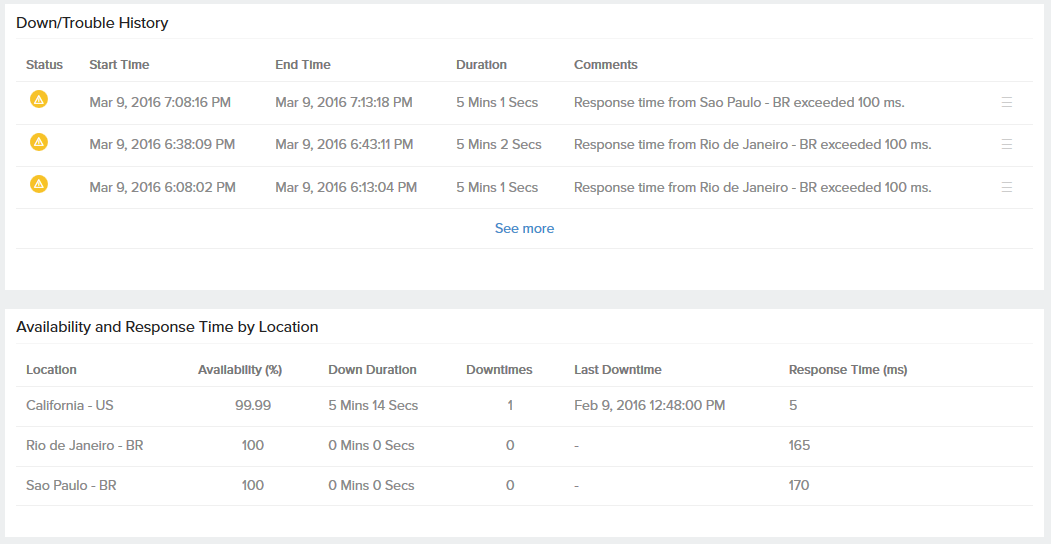
Availability and Response Time by Location
Attributes like availability and response time for your configured FTP server for each monitoring location is shown in a table format. The total availability percentage, and response time and down duration from each monitoring location can be viewed from this.
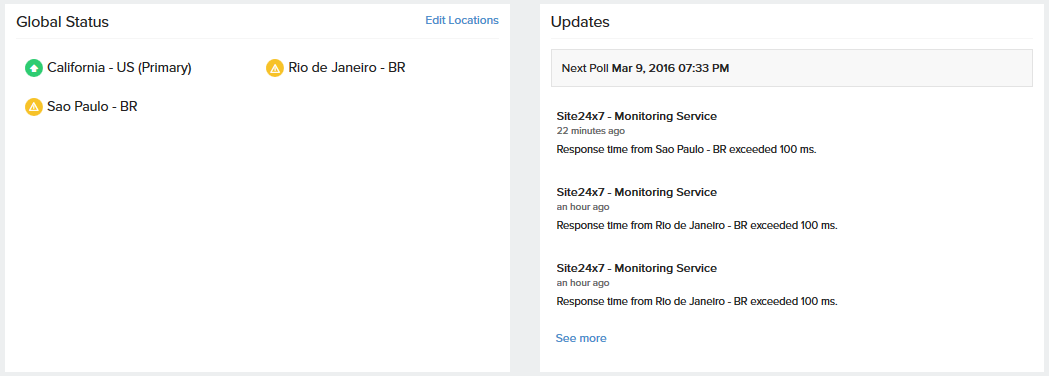
Global Status and Updates
Get an instant peek into the actual real-time status of your monitor from the configured geographical locations. Additionally, you can also view the real-time data from the various poll cycles and it includes the outages and trouble alerts data.
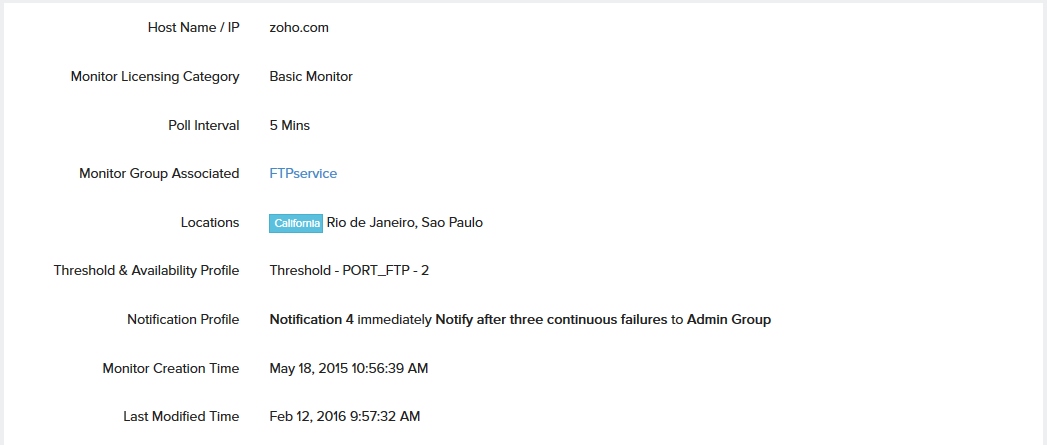
Inventory and Notes
This section captures the basic monitor information and also its various configuration settings including polling locations, poll interval, licensing type, and more.
Log Report
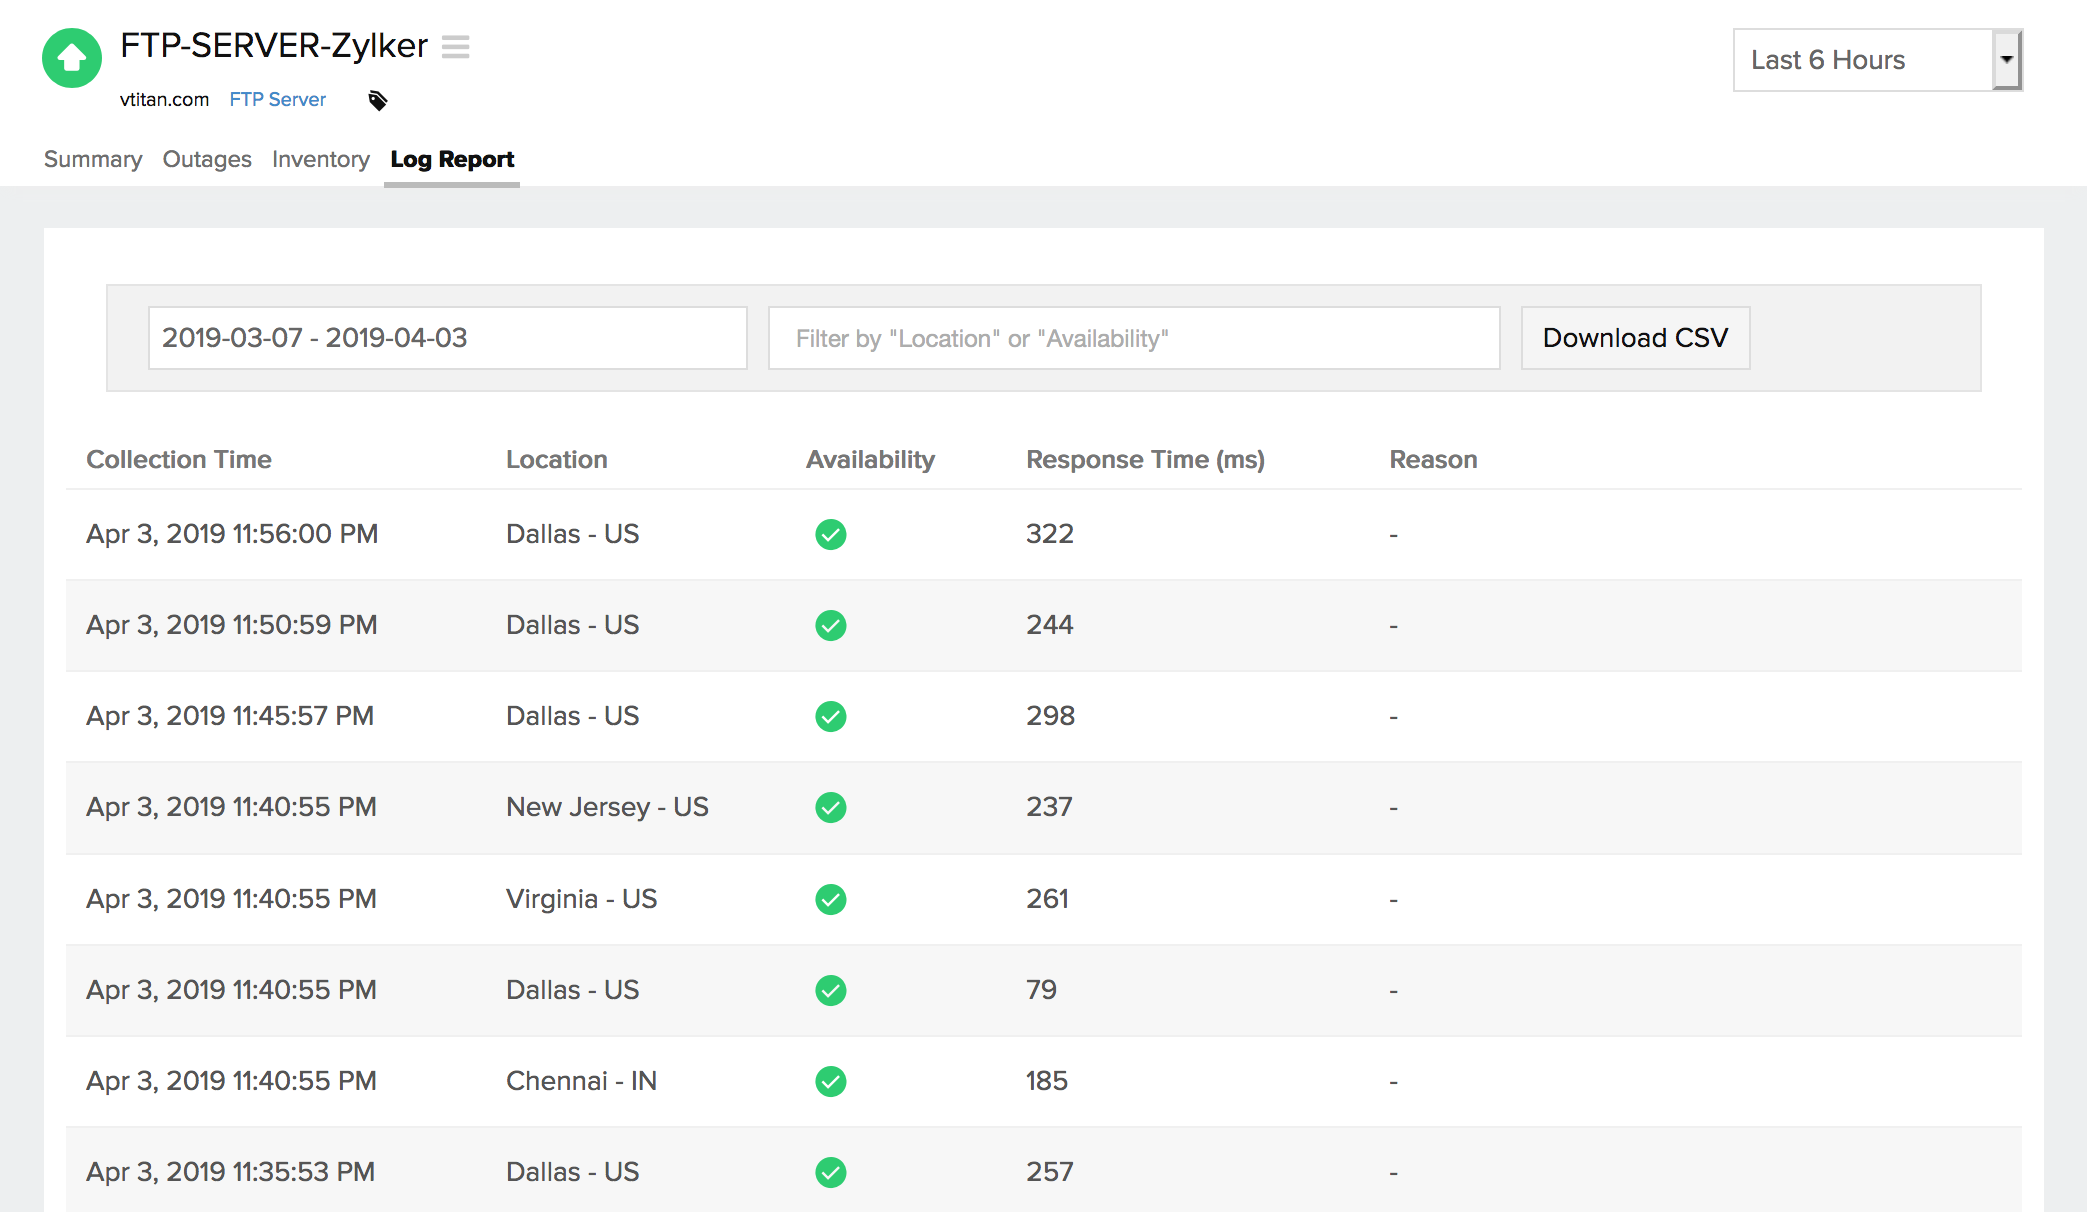
With our integrated log records for individual monitors, you can get an indepth knowledge about the various log details for the configured monitor, over a custom period. You can also filter the log based on location and availability. You have an option to download the log report in CSV format.
Learn more: How to set up a FTP Server Monitor?
