Performance metrics of Mail Delivery monitor
Interpret Mail Delivery monitor results
Site24x7's Mail Delivery monitor tracks the availability and performance of complete mail infrastructure from several geographical locations. Preset threshold values ensure generation of alarms and notifications for any outages detected by the system. This enables you to detect any performance bottlenecks and take corrective action at the proper time. To view the monitoring results, navigate to Home and click the desired Mail Delivery monitor. The metrics are reported in graphical and tabular layouts for easy assimilation. Historical and current Mail Server performance data, provide insights into the performance over a pre-set period.
Mail Delivery monitor mechanism:
- Site24x7 acting as an SMTP client opens a secure connection with the SMTP server and performs a basic handshake, once this is established the transmission of the test email occurs. This process is similar to how a webmail or email client works.
- The SMTP server checks the domain name of the test mail recipient and transfers the mail to the respective POP/IMAP server.
- Site24x7 remotely connects to your incoming mail server, authenticates itself with the username and password provided, scans the mail server for the appropriate subject field name or attachment name and retrieves the test mail via POP/IMAP.
- Site24x7 measures the average time delay between, the transmission of the test email and its reception. The test mail deployed will be automatically deleted from the mail server.
- Site24x7 will trigger an alert if any one of these aspects in the mail delivery process fails. Securely connect Site24x7 with your SMTP and POP/IMAP server by enabling transport-layer security or SSL encryption and provide a private and authenticated communication over the Internet.
Site24x7's Webclient control panel has a custom status banner, which identifies the various configured monitors by segregating them based on their operational status and state. You can also view the number of operational monitors and alert credits remaining in your account. By clicking the + Buy More button, you can purchase additional monitors and alert credits. You can share the monitor details via an email. Email can be sent to only those verified users who have agreed to receive emails from Site24x7.
Events Timeline
Events timeline widget records all the past events of your selected monitor for a selected time range. You can identify/decode various events from the past, which includes Down, Critical, Trouble, Maintenance, Suspended, or Anomalies. Each event are color coded for easy identification. Events can be drilled down to extract maximum data and facilitate easy troubleshooting. You can also track the actual outage period and the total outage duration during a specific block of time.
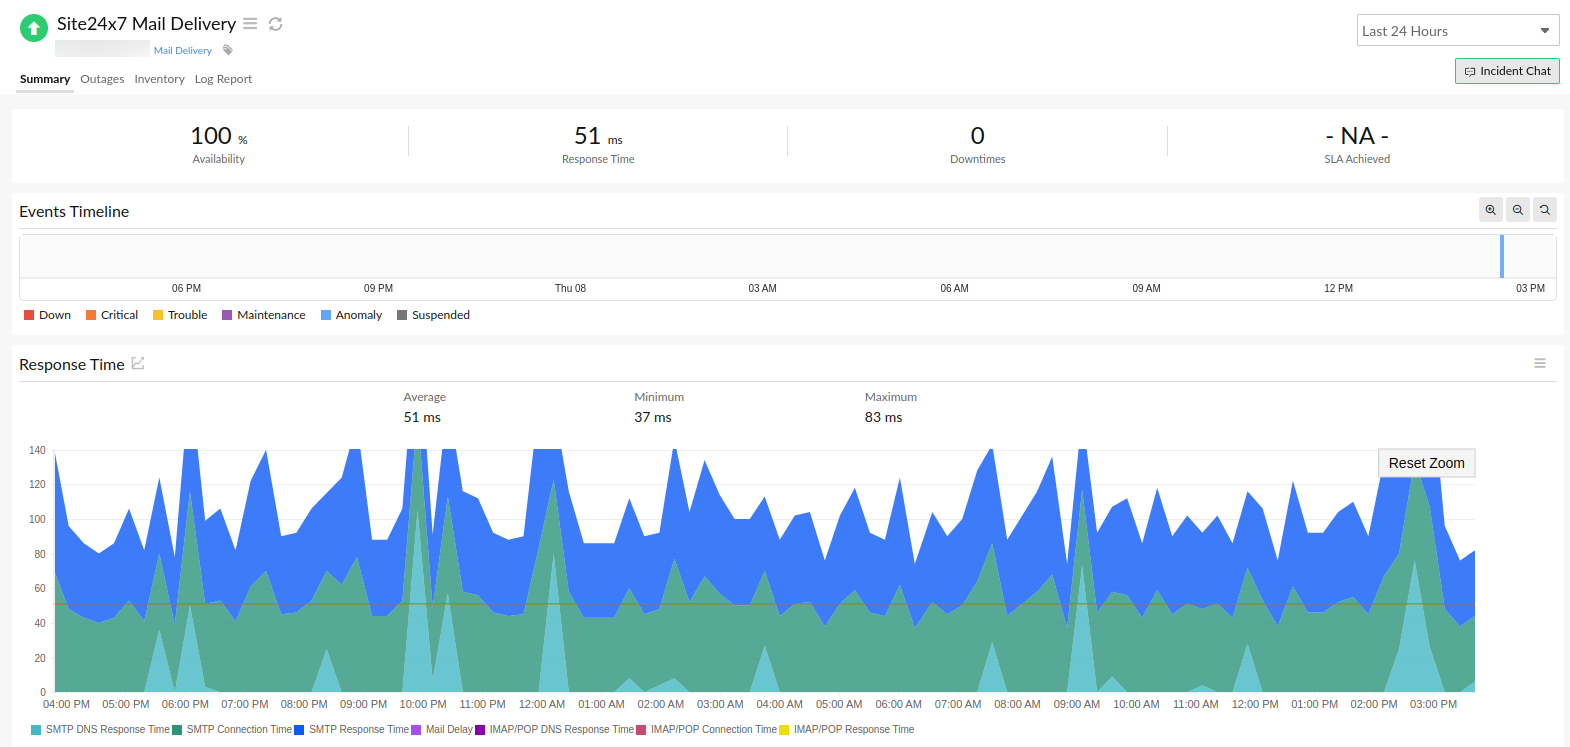
The main result page is classified into two sections:
- Response Time gives you an overview of the Email round-trip-time of the Mail Server, SMTP DNS Response Time, SMTP Connection Time, IMAP/POP DNS Response Time, IMAP/POP Connection Time, SMTP Response Time, IMAP/POP Response Time, and Mail Delay in milliseconds. This data is presented as a graphical report.
- Availability & Response Time by Location, which gives a graphical and tabular report of location based availability of the Mail Server and Mail Server round-trip-time in milliseconds.
Response Time
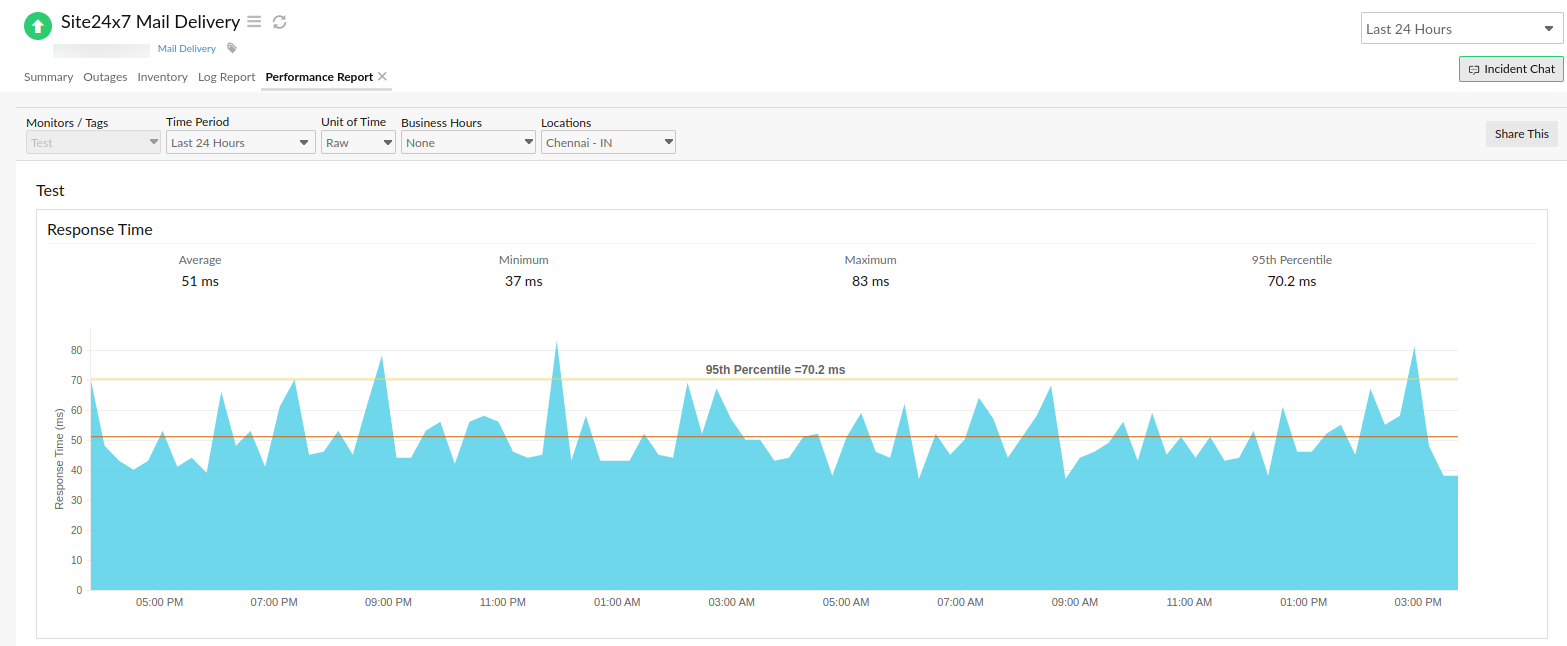
The Email Response Time of the Mail Server across all the monitoring locations for the chosen time period is calculated and shown using an area graph. Timely knowledge about the sluggish performance of your Mail Server can be gauged from this graph. Average/95th Percentile values depend on the time frame chosen for the reportage. Response Time graph throws light on the average/95th Percentile Email response time of the Mail Server for each day or hour from every monitoring location. You can further filter out the three point, five point moving averages and also the 95 percentile by selecting the appropriate legends. The graph also lets you zoom in and isolate the exact data from the graphical spikes. You can also add specific notes to inform users about the various outages and maintenance activities.
Outages
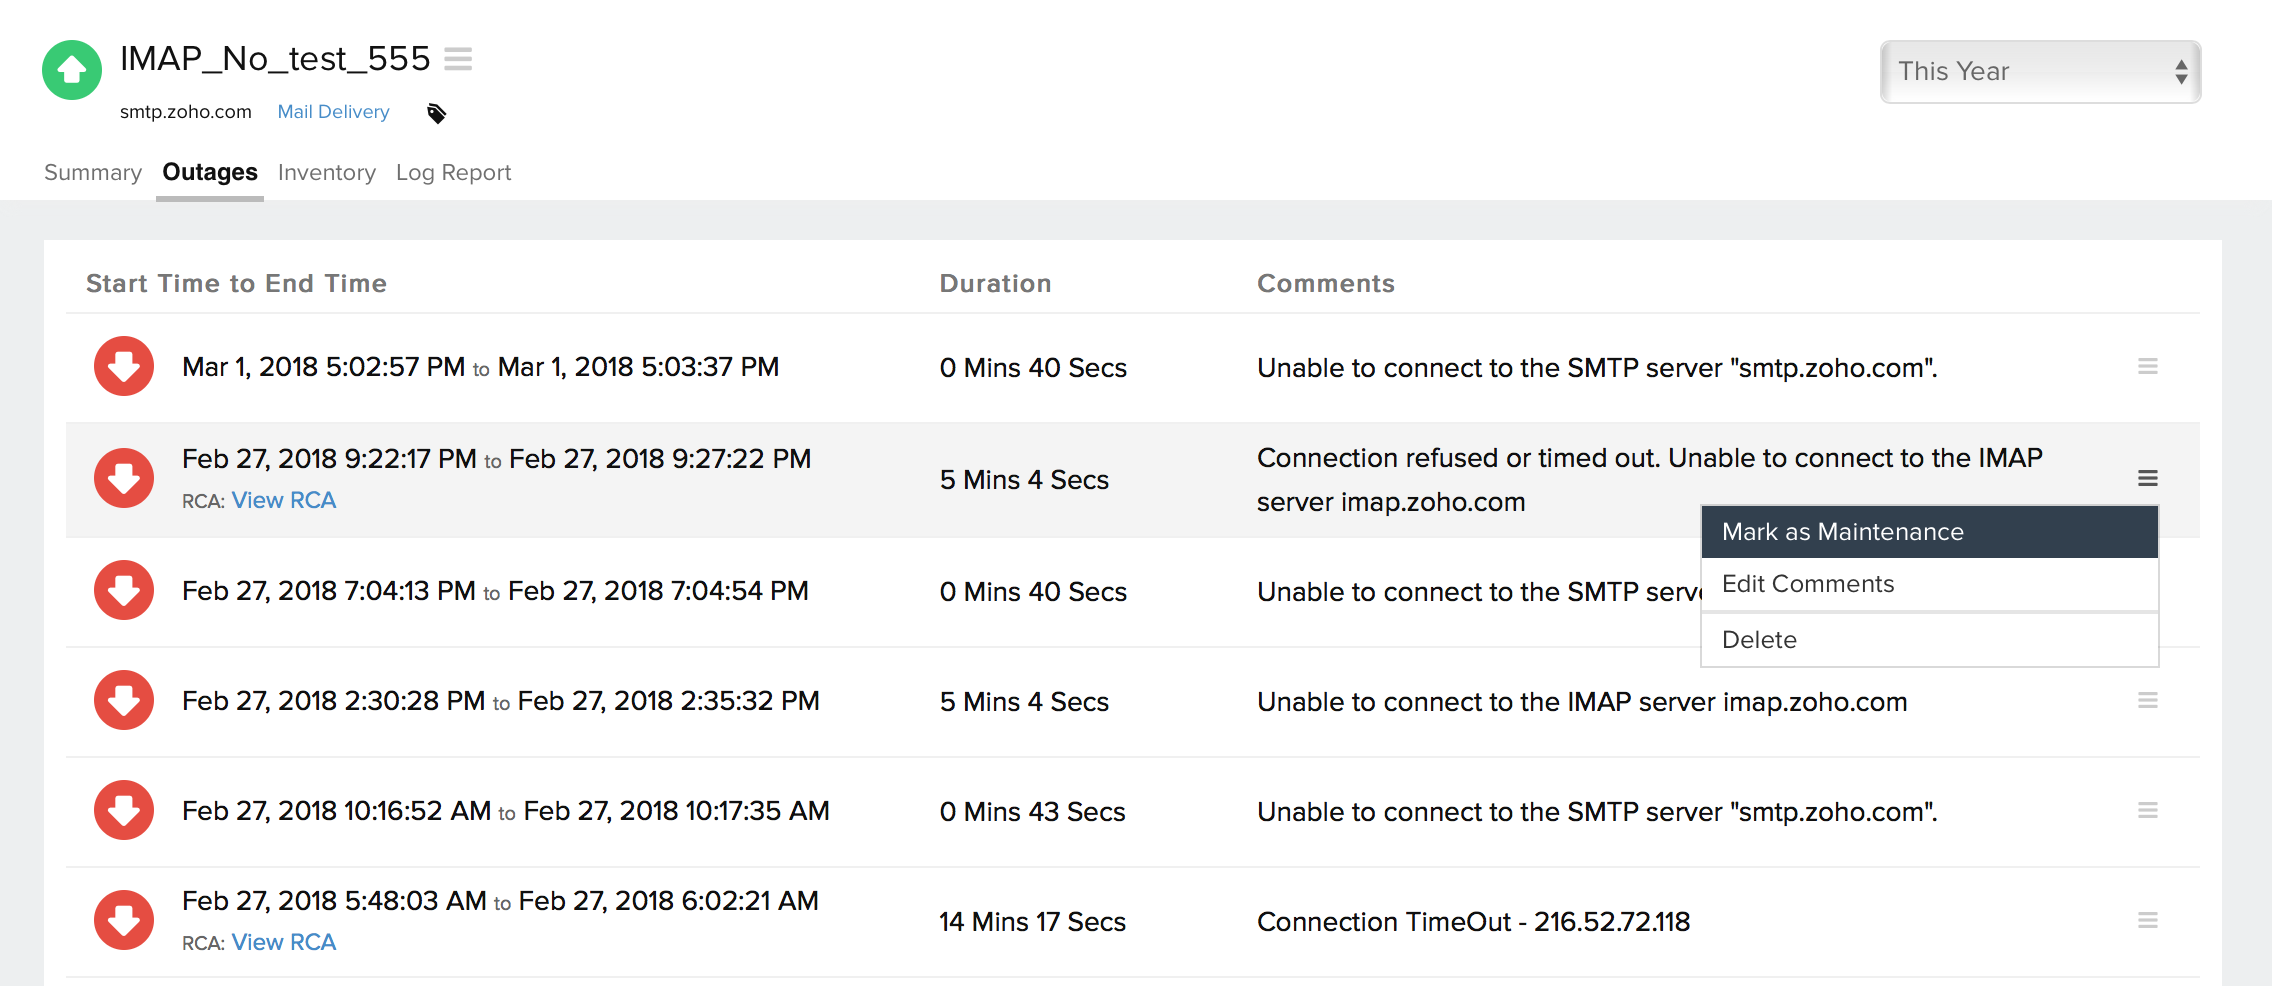
You can access the Outages tab in your monitor's details page to gather detailed insights on the various outage and maintenance downtimes. It provides you with sufficient information to troubleshoot issues. You'll also be able to access the root cause analysis reports for your various outages. On accessing the ![]() icon of a listed monitor outage or maintenance, you'll be shown the options to:
icon of a listed monitor outage or maintenance, you'll be shown the options to:
- Mark as Maintenance: Mark an outage as Maintenance
- Mark as Downtime: Mark a maintenance as Downtime
- Edit Comments: Add or edit comments
- Delete: Delete an outage or maintenance permanently
Root Cause Analysis (RCA) Report
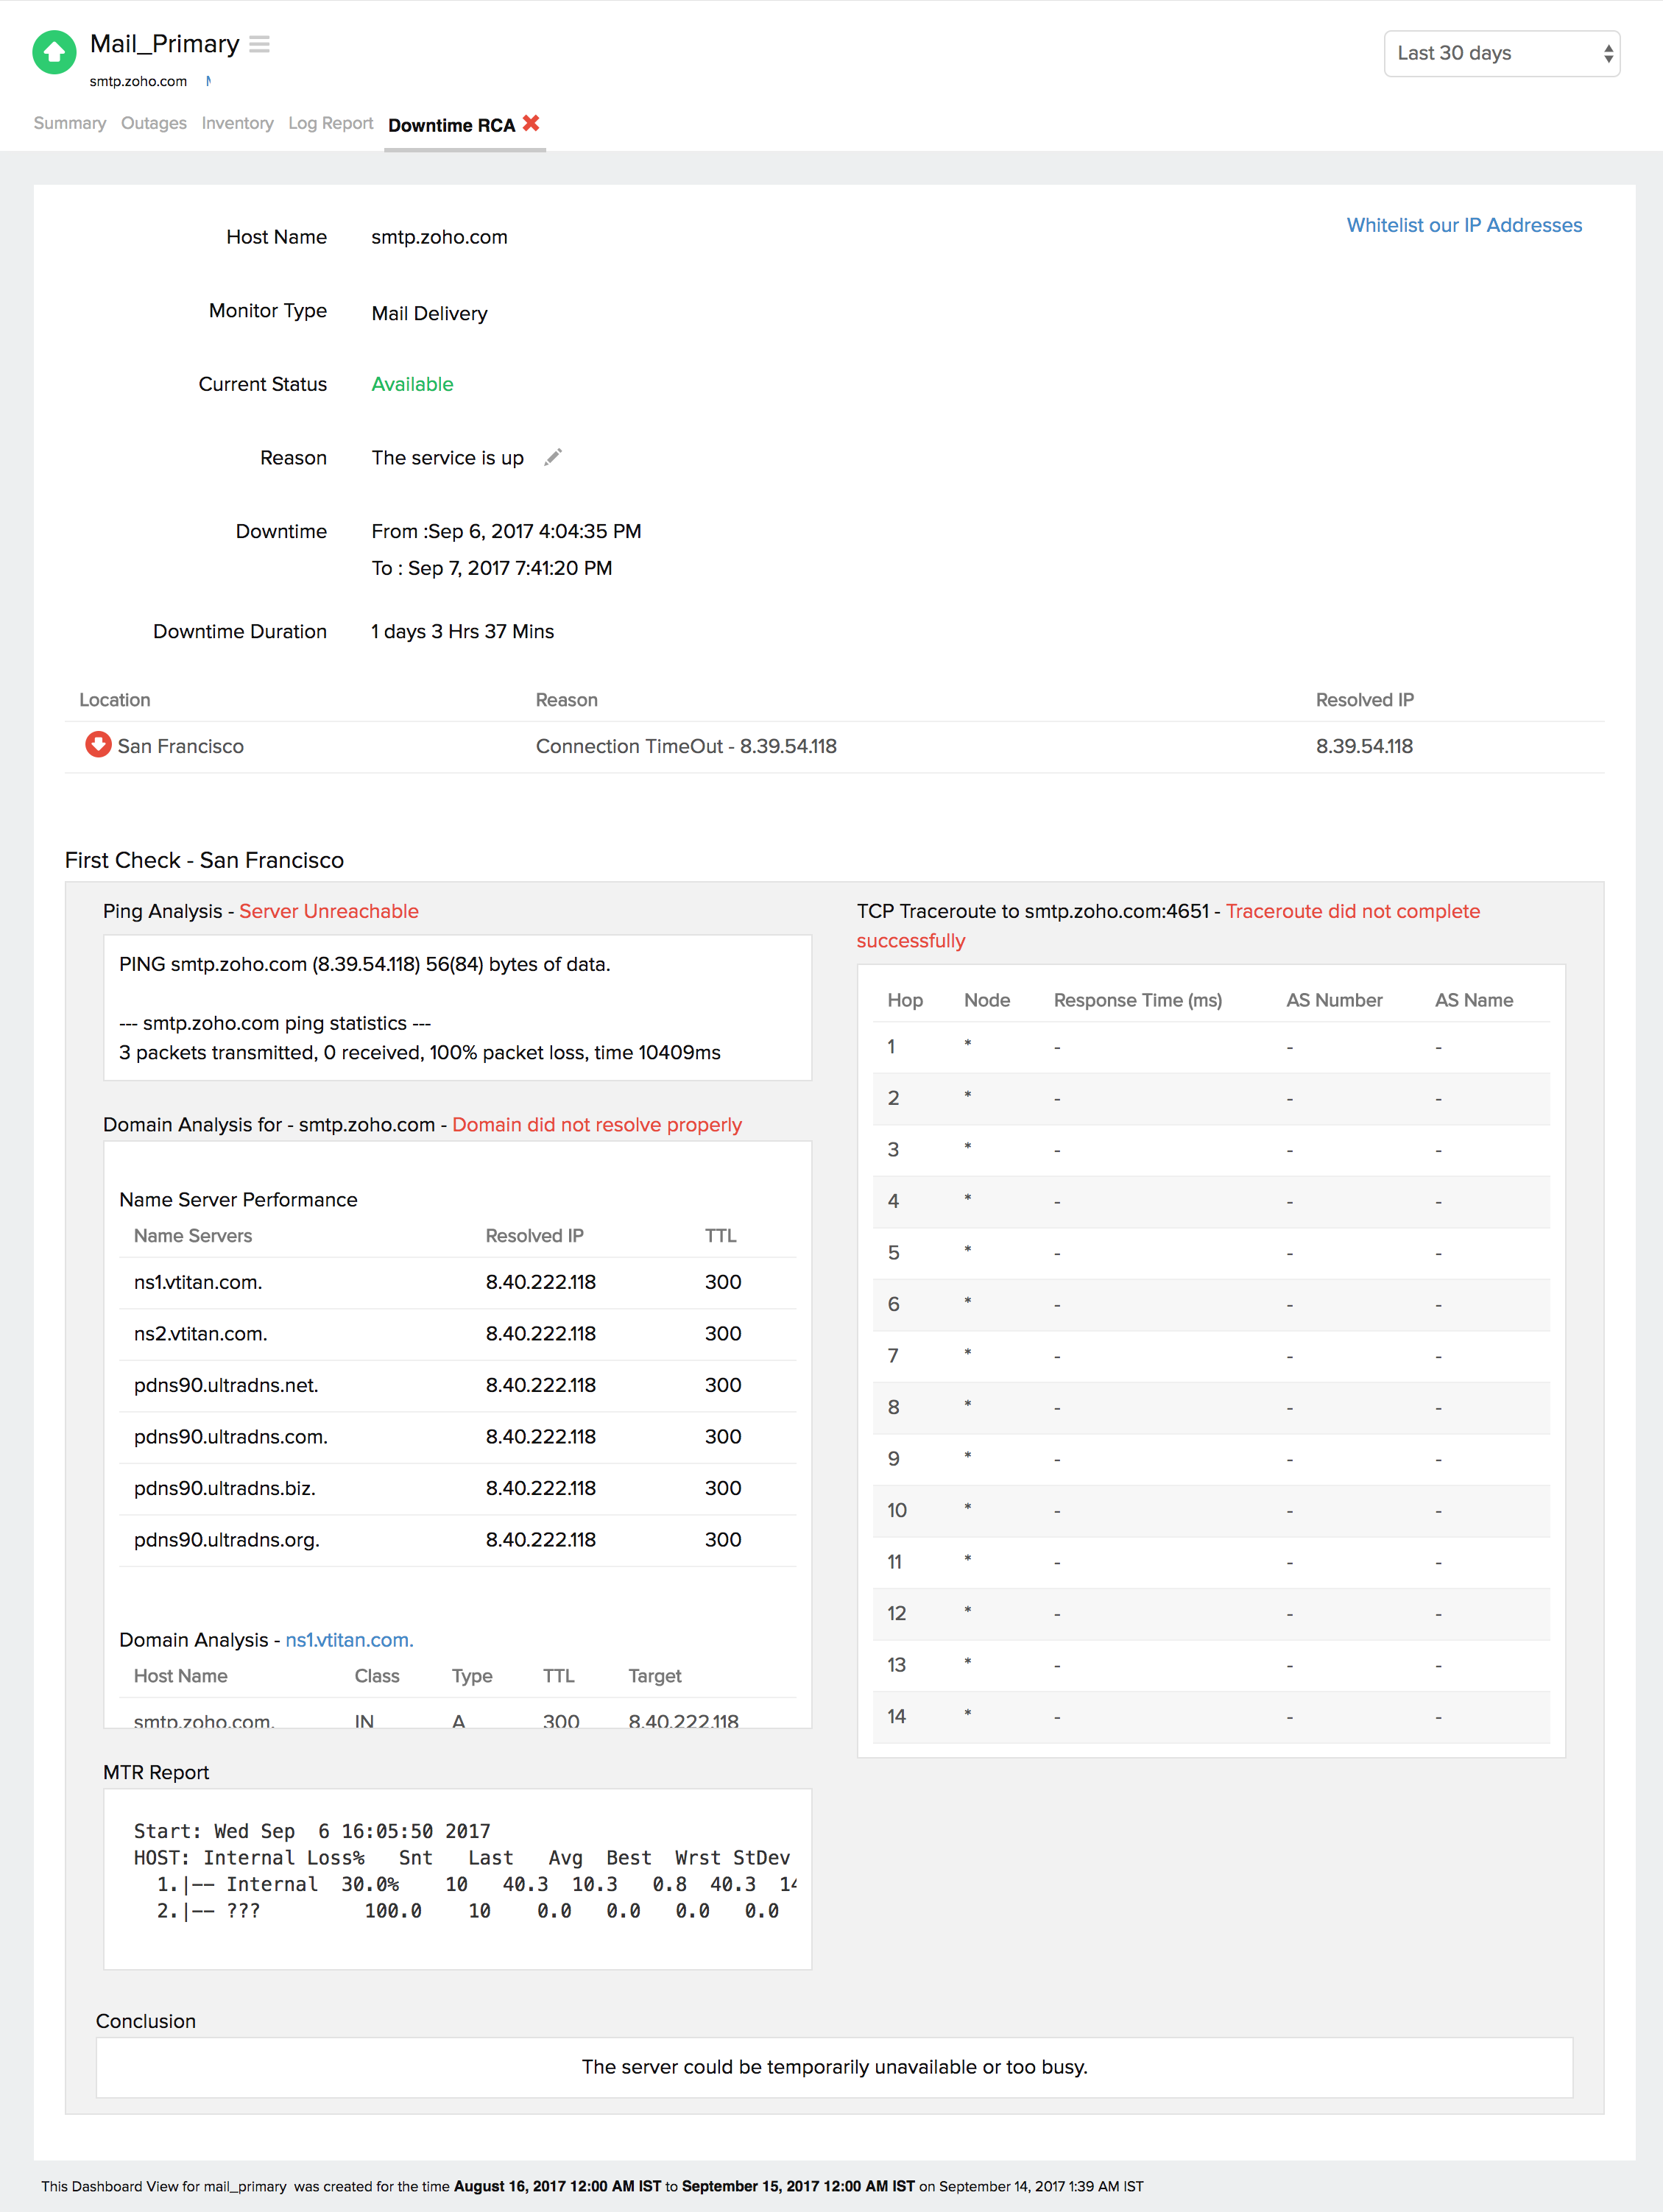
You can retrieve indepth root cause analysis report for your Down monitors after 150 seconds of the monitor reporting the outage. RCA Report gives basic details about your monitor, outage details, recheck details and reasons for the outage. Root Cause Analysis automatically generates a plethora of information to arrive at a definite conclusion as to what triggered a downtime. RCA intends to determine the root cause of specific downtime or performance issue. A normal RCA report will comprise of the following details:
- Checks from Primary location and re-checks from Secondary location.
- Ping Analysis
- DNS Analysis
- TCP Traceroute
- MTR Report
- MTR based Network Route
- View Events
- Conclusion
View Events
You can view a list of events that occurred during the downtime for a specific location. This will help you obtain a detailed analysis for your RCA report. Click the View Events link to access the list of events, including the corresponding time in milliseconds.

Availability and Response Time by Location
Attributes like availability and response time for your configured Mail server for each monitoring location is shown in a table format. The total availability percentage, and response time and down duration from each monitoring location can be viewed from this.

Global Status and Updates
Get an instant peek into the actual real-time status of your monitor from the configured geographical locations. Additionally, you can also view the real-time data from the various poll cycles and it includes the outages and trouble alerts data.

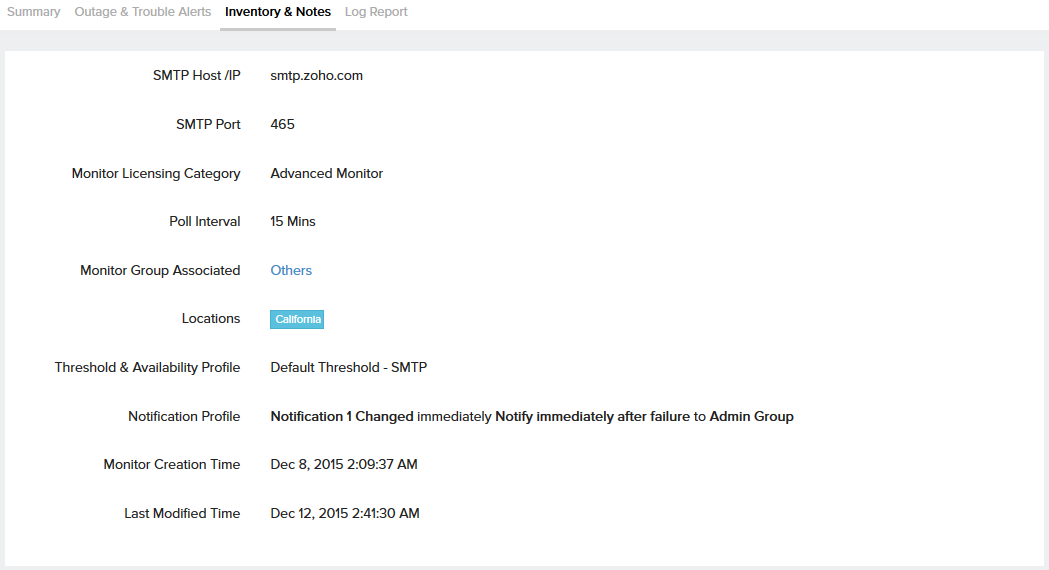
Inventory and Notes
This section captures the basic monitor information and also its various configuration settings including polling locations, poll interval, licensing type, and more.
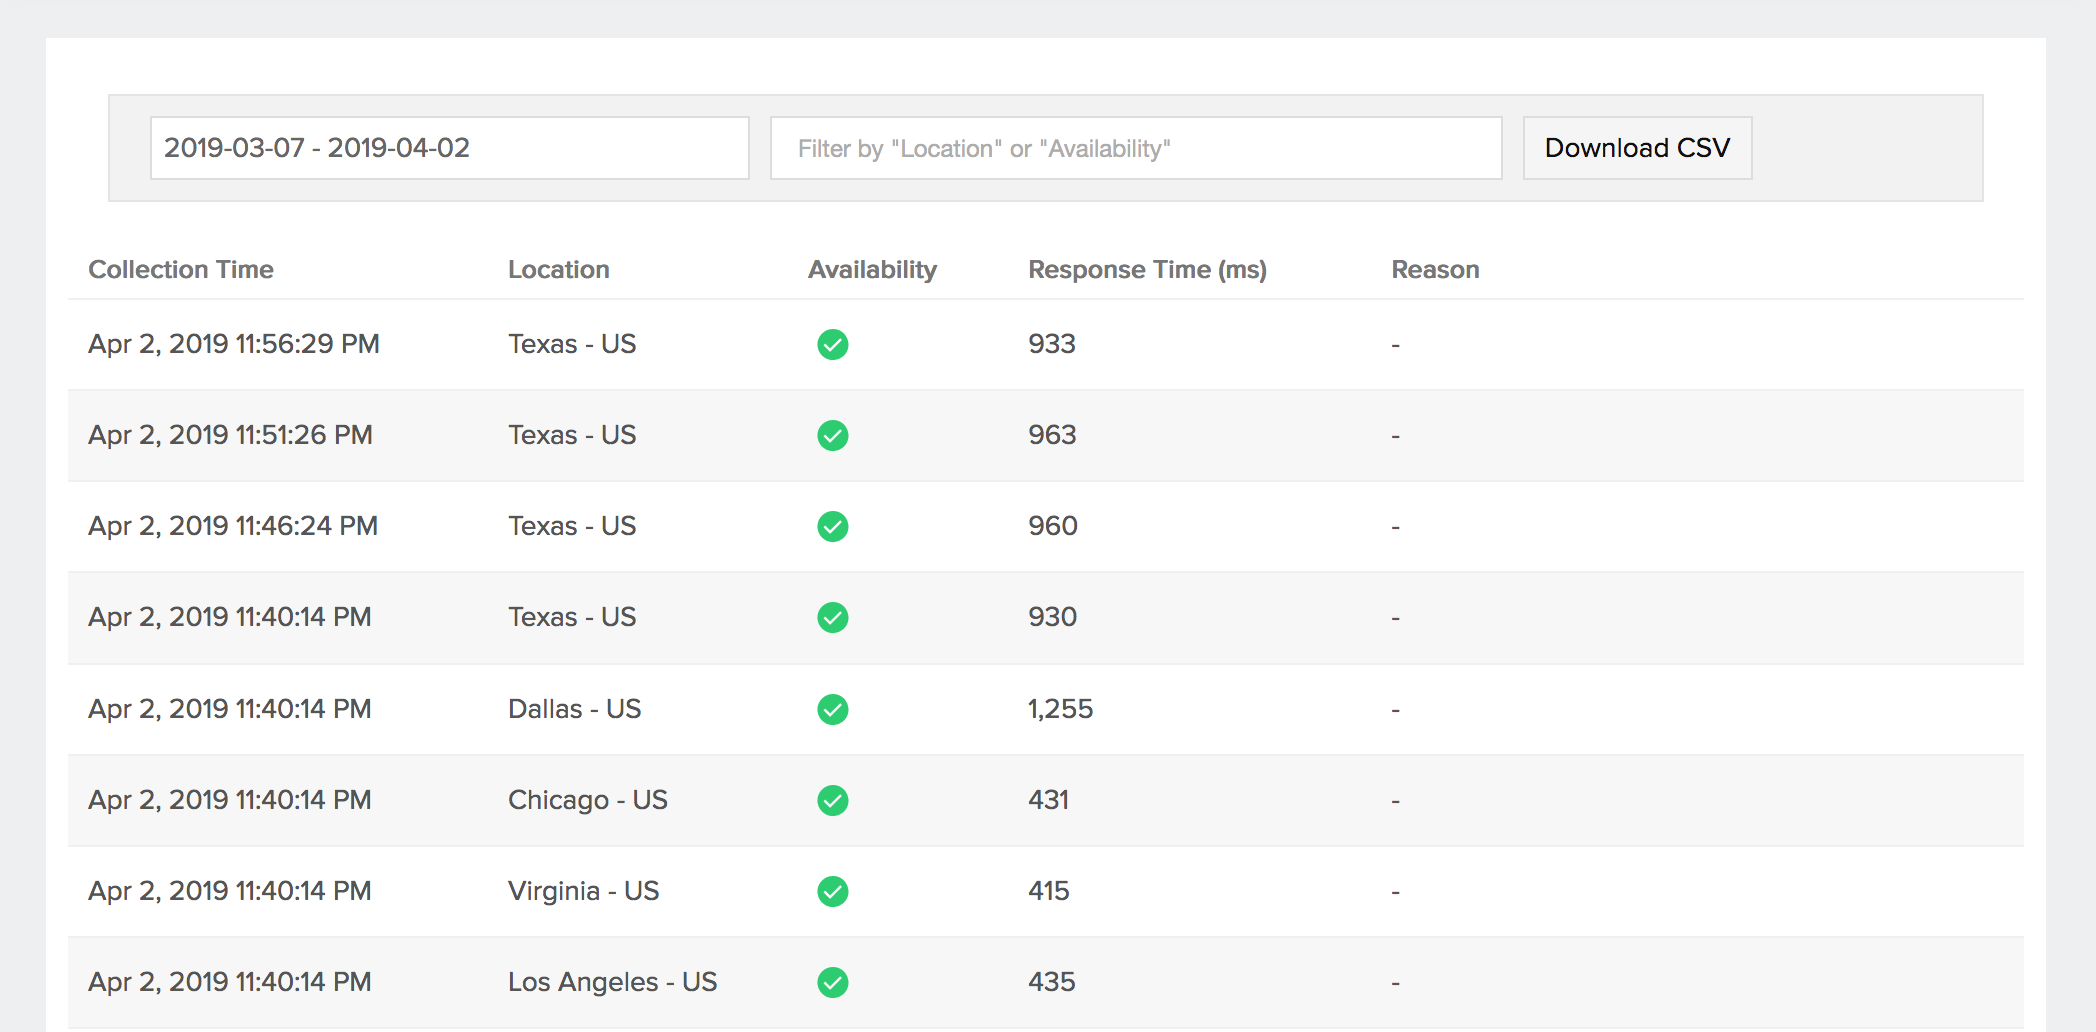
Log Report
With our integrated log records for individual monitors, you can get an indepth knowledge about the various log details for the configured monitor, over a custom period. You can also filter the log based on location and availability. You have an option to download the log report in CSV format.
Learn more: How to set up a Mail Delivery monitor?
