Performance Report
Performance Report provides the availability and response time of your configured monitors with respect to various monitoring locations. For a selected monitor group, the performance of your configured monitors from various monitoring locations can now be easily viewed in detail. You can also identify monitors with poor response time and take corrective measures wherever and whenever necessary.
Generate Performance Report
- Log in to your Site24x7 account.
- Navigate to Reports > Monitor Groups > Performance Report.
- Select required monitor group from the header dropdown and change the listed parameters to view a customized report.
- Monitor Groups: Select the desired monitor group from the drop down list.
- Time Period: Choose the required time period.
NoteYou can generate reports for time periods ranging from last 1,6,12, or 24 hours, as well as any custom date range for the previous year.
- Metric Aggregation:
- You can either choose the Average value or the 95th percentile value to spot outliers. The 95th percentile is the value which is greater than or equal to 95% of the observed values of your polled data during the selected time range. In other words, 95% of the responses were faster than this value.
- If you choose Monitor Groups or All Monitors, you have the option to choose the maximum and minimum metric data.
- Include Subgroup Monitors: Enable this option to include subgroups of the selected Monitor Groups. Otherwise, only the selected Group will be considered.
- Once the report is generated, click "Share This" button on the top right corner, then select one of the following:
- Publish Report: Click publish report and populate the form. This creates a permalink that would make the report accessible to customers without a login.
- Export CSV: Export the report as a CSV file.
- Export PDF: Export the report as a PDF file.
- Email: Share the report via an email to those verified users who've opted to receive email notifications from Site24x7.
- Schedule Report: Populate the schedule report form, to create a report task that would trigger performance reports to be sent to a customer.
Interpret Performance Report
Performance reports are categorized into two, based on the mode of monitoring required:
- Agentless monitors are classified and displayed under the End User Monitor Summary
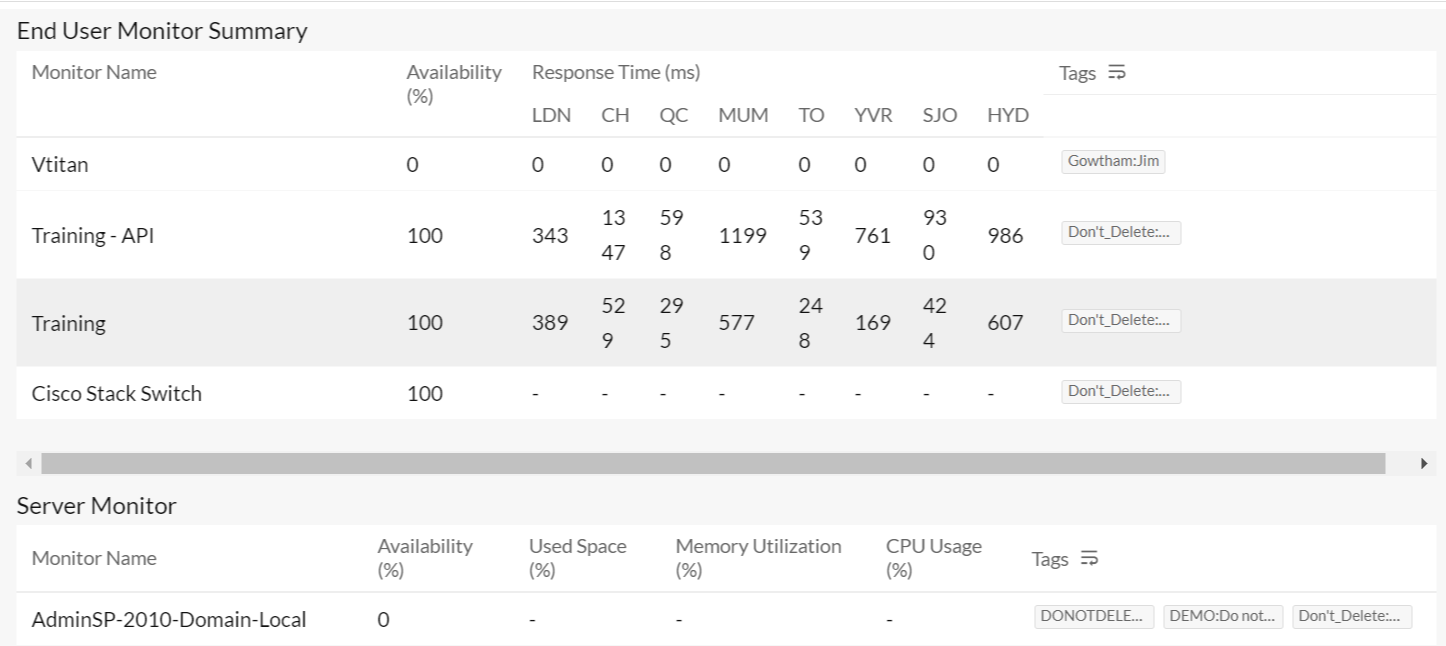
- End User Monitor Summary: Here you can view the Availability of your monitors and the Response Time from various geographical locations, which will help you understand whether there are any ISP-specific reasons preventing your users from reaching your website. For example, if your service provider has issues accessing websites in the UK and your UK-based website is targeted at an India-specific audience, you would want to know about that issue so that you can contact the service provider and inform them to correct the problem.

- End User Monitor Summary: Here you can view the Availability of your monitors and the Response Time from various geographical locations, which will help you understand whether there are any ISP-specific reasons preventing your users from reaching your website. For example, if your service provider has issues accessing websites in the UK and your UK-based website is targeted at an India-specific audience, you would want to know about that issue so that you can contact the service provider and inform them to correct the problem.
- Agent-based monitors includes Server and VMware monitors, and are listed separately. Their corresponding performance parameters for each monitor is captured and presented in a tabular layout.
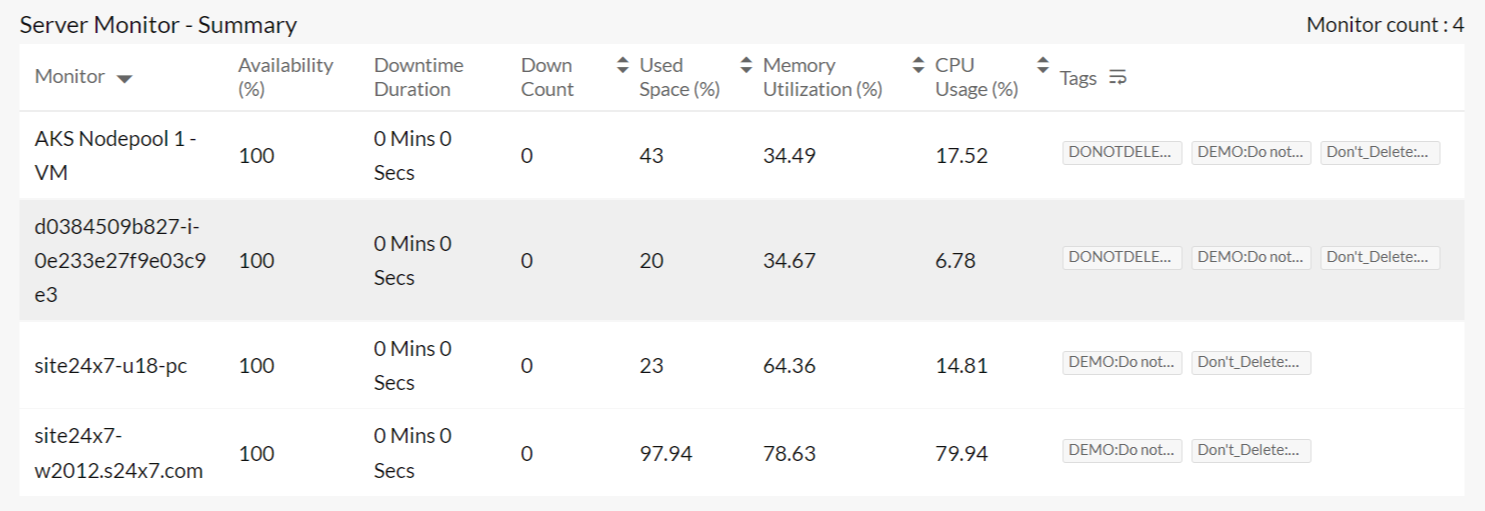
- Agent-based Monitor Summary: Various parameters that demonstrate your servers' performance are listed under the Agent-based Monitor Summary. Parameters like Server Availability, CPU Performance, Memory Utilization, Disk Space Usage, and many more are detailed here.

- Agent-based Monitor Summary: Various parameters that demonstrate your servers' performance are listed under the Agent-based Monitor Summary. Parameters like Server Availability, CPU Performance, Memory Utilization, Disk Space Usage, and many more are detailed here.
View related reports
-
On this page
- Generate Performance Report
- Interpret Performance Report
